

| Rank This Year | Rank Last Year | Company | Revenue (000) | Net Income (000) | Employees | Tractors* | Trailers |
|---|---|---|---|---|---|---|---|
| 1 | 1 | UPS Inc.
|
65,872,000 | 4,910,000 | 454,000 | 18,683 | 97,746 |
| 2 | 2 | FedEx Corp.
|
63,864,000 | 4,465,000 | 425,000 | 29,873 | 113,218 |
| 3 | 3 | XPO
|
15,380,800 | 312,400 | 95,000 | 16,287 | 27,591 |
| 4 | 4 | J.B. Hunt Transport Services
|
7,189,568 | 385,308 | 27,670 | 14,392 | 32,931 |
| 5 | 30 | Knight-Swift Transportation Holdings
|
5,136,261 | 529,922 | 25,400 | 23,069 | 74,949 |
| 6 | 5 | Yellow Corp.
|
4,891,000 | -10,800 | 32,000 | 14,100 | 44,600 |
| 7 | 6 | Schneider
|
4,383,600 | 389,900 | 19,600 | 11,859 | 37,637 |
| 8 | 9 | Hub Group
|
4,034,897 | 135,153 | 4,377 | 3,520 | 5,850 |
| 9 | 10 | TFI International
|
3,906,575 | 130,181 | 17,044 | 16,132 | 24,617 |
| 10 | 9 | Landstar System
|
3,646,364 | 177,088 | 1,273 | 9,438 | 15,534 |
| 11 | 11 | Old Dominion Freight Line
|
3,358,112 | 463,774 | 20,944 | 8,316 | 32,890 |
| 12 | 13 | Ryder System
|
3,065,500 | 158,400 | |||
| 13 | 12 | ArcBest
|
2,826,457 | 59,726 | 13,000 | 4,436 | 22,275 |
| 14 | 14 | Estes Express Lines
|
2,740,000 | - | 17,397 | 6,695 | 27,443 |
| 15 | 16 | Werner Enterprises
|
2,116,737 | 92,000 | 12,154 | 7,480 | 24,500 |
| 16 | 15 | Roadrunner Freight
|
2,091,300 | -91,200 | 4,600 | 3,625 | 6,920 |
| 17 | 27 | NFI
|
1,910,000 | - | 10,000 | 4,000 | 8,900 |
| 18 | 18 | Prime Inc.
|
1,875,031 | 208,184 | 4,300 | 6,296 | 12,753 |
| 19 | 21 | Penske Logistics
|
1,700,000 | - | 18,011 | 2,935 | 9,108 |
| 19 | 17 | UniGroup
|
1,700,000 | - | |||
| 21 | 21 | U.S. Xpress Enterprises
|
1,600,000 | - | 9,522 | 6,600 | 16,800 |
| 22 | 24 | R+L Carriers
|
1,580,000 | - | 5,084 | 15,675 | |
| 23 | 19 | CRST The Transportation Solution
|
1,555,000 | - | 7,538 | 5,774 | 12,145 |
| 24 | 25 | Kenan Advantage Group
|
1,441,440 | - | 9,000 | 6,686 | 10,744 |
| 25 | 26 | C.R. England
|
1,405,411 | - | 7,975 | 4,213 | 6,116 |
| 26 | 21 | Sirva
|
1,400,000 | - | |||
| 27 | 28 | Saia Inc.
|
1,378,510 | 91,156 | 9,800 | 4,259 | 13,901 |
| 28 | 20 | Purolator
|
1,343,111 | - | 10,000 | 465 | 1,329 |
| 29 | 42 | Daseke Inc. (TFI)
|
1,300,000 | 26,996 | 4,700 | 5,200 | 11,500 |
| 30 | 29 | Southeastern Freight Lines
|
1,260,050 | - | 8,792 | 3,635 | 11,697 |
| 31 | 32 | Universal Logistics Holdings
|
1,216,665 | 28,153 | 8,231 | 3,784 | 5,765 |
| 32 | 31 | Averitt Express
|
1,146,970 | 98,967 | 8,500 | 4,513 | 14,585 |
| 33 | 37 | Forward Air
|
1,100,816 | 87,321 | 4,898 | 964 | 6,464 |
| 34 | 35 | Crete Carrier Corp.
|
1,100,000 | - | 6,000 | 5,400 | 14,000 |
| 35 | 33 | Celadon Group Inc.
|
1,065,356 | - | 5,200 | 3,850 | 10,000 |
| 36 | 34 | Anderson Trucking Service
|
1,004,301 | - | 1,996 | 2,652 | 6,958 |
| 37 | 38 | KLLM Transport Services
|
959,000 | - | 3,800 | 5,700 | |
| 38 | 39 | Lynden
|
950,000 | - | 2,600 | 768 | 2,889 |
| 39 | 59 | Evans Delivery
|
898,000 | - | 376 | 5,014 | 550 |
| 40 | 41 | Atlas World Group
|
842,100 | 4,800 | 671 | 1,271 | 4,076 |
| 41 | 40 | Ruan
|
836,298 | - | 5,500 | 2,900 | 8,710 |
| 42 | 43 | Quality Carriers
|
786,000 | - | 2,541 | 5,204 | |
| 43 | 44 | Central Transport International
|
754,000 | - | 3,180 | 6,543 | |
| 44 | 36 | Cardinal Logistics
|
720,000 | - | 4,245 | 2,905 | 7,940 |
| 45 | 51 | Day & Ross
|
718,941 | - | 2,240 | 1,800 | 5,714 |
| 46 | 50 | Pitt Ohio
|
715,827 | - | 5,381 | 1,856 | 5,372 |
| 47 | 47 | Covenant Logistics Group
|
705,007 | 55,439 | 4,297 | 2,700 | 7,389 |
| 48 | 46 | Marten Transport
|
698,120 | 90,284 | 3,492 | 2,738 | 4,909 |
| 49 | 49 | Stevens Transport
|
694,980 | 83,845 | 2,925 | 2,810 | 4,010 |
| 50 | 53 | AAA Cooper Transportation
|
665,000 | - | 5,000 | 3,000 | 6,500 |
| 51 | 56 | United Road Services
|
645,000 | - | 1,700 | 1,850 | 1,150 |
| 52 | 58 | Mullen Group
|
627,372 | - | 3,535 | 1,919 | 5,065 |
| 53 | 52 | Heartland Express
|
607,336 | 75,173 | 3,800 | 6,719 | 19,975 |
| 54 | 48 | Jack Cooper Holdings
|
602,825 | 74,839 | 3,753 | 2,637 | |
| 55 | 61 | PS Logistics
|
595,780 | - | 3,000 | 2,500 | |
| 56 | 45 | Trimac Transportation
|
576,796 | - | 3,200 | 1,720 | 3,800 |
| 57 | 56 | OnTrac Inc.
|
572,856 | - | 36 | 950 | |
| 58 | 55 | Western Express
|
566,230 | 41,998 | 2,850 | 2,555 | 7,800 |
| 59 | 60 | Dayton Freight Lines
|
562,000 | - | 4,501 | 1,561 | 3,803 |
| 60 | 54 | Suddath
|
550,000 | - | |||
| 61 | 62 | Canada Cartage
|
546,309 | - | 3,137 | 2,548 | 2,817 |
| 62 | 69 | Bennett Family of Cos.
|
512,874 | - | 1,023 | 1,345 | 2,126 |
| 63 | 63 | Mercer Transportation
|
492,509 | - | 293 | 2,299 | 2,299 |
| 64 | Two Men and a Truck Movers
|
487,236 | - | 6,136 | |||
| 65 | 74 | Bison Transport
|
472,004 | - | 2,944 | 1,704 | 4,732 |
| 66 | 67 | Cowan Systems
|
462,544 | - | 1,946 | 2,122 | 5,677 |
| 67 | 10 Roads Express
|
452,429 | - | 1,935 | 2,421 | ||
| 68 | 64 | Dart Transit Co.
|
451,925 | - | 2,626 | 2,131 | 7,159 |
| 69 | 70 | USA Truck
|
446,533 | 7,497 | 2,400 | 1,669 | 5,596 |
| 70 | 66 | Shevell Group
|
439,500 | - | 3,745 | 1,550 | 3,950 |
| 71 | 68 | P.A.M. Transport
|
437,838 | 38,899 | 2,409 | 2,281 | 5,795 |
| 72 | 72 | Mesilla Valley Transportation
|
430,261 | - | 1,760 | 1,450 | 6,000 |
| 73 | 71 | TransX Group of Companies
|
415,541 | - | 2,617 | 1,365 | 4,410 |
| 74 | 73 | TMC Transportation
|
413,000 | - | 2,613 | 3,404 | |
| 75 | 79 | Black Horse Carriers
|
412,500 | - | 3,150 | 1,670 | 3,500 |
| 76 | 81 | Epes Carriers Inc.
|
400,977 | 26,309 | 1,272 | 6,065 | |
| 77 | LaserShip Inc./OnTrac Inc.
|
400,000 | - | 29 | 27 | ||
| 78 | 76 | Roehl Transport
|
384,473 | - | 2,336 | 1,983 | 4,873 |
| 79 | 78 | A. Duie Pyle
|
373,000 | - | 2,697 | 946 | 1,936 |
| 80 | 80 | Maverick USA
|
352,068 | - | 2,122 | 1,648 | 2,480 |
| 81 | 87 | Transport Investments
|
339,920 | - | 190 | 1,037 | 1,846 |
| 82 | 84 | IMC Logistics
|
332,490 | - | 2,300 | 1,658 | 148 |
| 83 | 82 | Dicom Transportation Group
|
320,700 | - | |||
| 84 | 94 | Salmon Cos.
|
314,303 | - | 713 | 1,092 | |
| 85 | 83 | Cassens Transport
|
302,004 | - | 1,265 | 1,231 | 1,231 |
| 86 | 88 | TransAm Trucking
|
280,000 | - | 1,135 | 1,823 | |
| 87 | 92 | Hirschbach Motor Lines
|
278,494 | - | 800 | 1,250 | 1,965 |
| 88 | 91 | Foodliner/Quest Liner
|
277,471 | - | 1,190 | 1,183 | 2,233 |
| 89 | 85 | Koch Cos.
|
277,000 | - | 1,190 | 1,053 | 5,476 |
| 90 | 86 | Dependable Supply Chain Services
|
274,000 | - | 344 | 1,220 | |
| 91 | 90 | Trans-System
|
271,000 | - | 1,050 | 1,000 | 1,700 |
| 92 | Melton Truck Lines
|
269,785 | - | 1,569 | 1,310 | 2,111 | |
| 93 | 77 | Central Freight Lines
|
266,000 | - | 2,001 | 8,012 | |
| 94 | 97 | Martin Transportation Systems
|
261,403 | - | 1,725 | 1,060 | 2,250 |
| 95 | 100 | Quantix Supply Chain Solutions
|
259,370 | - | 1,100 | 858 | 1,132 |
| 96 | 89 | Challenger Motor Freight
|
258,734 | - | 1,850 | 1,469 | 3,300 |
| 97 | 93 | United Vision Logistics
|
256,000 | - | 1,003 | 1,347 | |
| 98 | 99 | Superior Bulk Logistics
|
252,300 | 14,500 | 1,370 | 1,100 | 2,000 |
| 99 | 96 | John Christner Trucking
|
244,696 | 13,138 | 222 | 809 | 1,112 |
| 100 | Acme Truck Line
|
239,000 | - | 1,900 | 1,315 | 1,314 |
Top For-Hire Carriers on this list are common and contract freight carriers operating in the United States, Canada and Mexico. Companies are ranked on the basis of annual revenue. To be included in the Top 100 or any of the sectors, please send contact information to tteditor@ttnews.com. We will contact you via phone or e-mail to get information about your company prior to publication of the next Top 100 list.
* Tractor count includes company-owned, lease-to-own and owner-operator tractors.

On the Bubble


J.B. Hunt Reports Q2 Revenue Jump to $3.84 Billion

J.B. Hunt Transport Services Inc. on July 19 posted earnings and revenue growth for the second quarter that was driven by strong segment results.
Marten Reports Record-Breaking Results for Q2
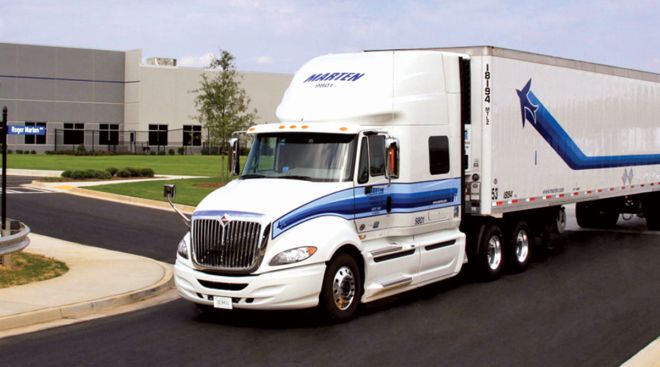
Marten Transport on July 18 reported the highest operating revenue and operating income in its history for the second quarter.
UPS Expands Cargo Services in India to Seize Airfreight Boom

UPS Inc. opened a second airport cargo-handling facility in India to capture soaring pandemic-driven demand for airfreight.
Trucking Faces Pressure to Prepare for Holidays Early

Supply chain pressures are forcing trucking to get an early start to the holiday shipping season despite a shift of underlying conditions within the industry.
Averitt Announces Pay Increases for Drivers

Cookeville, Tenn.-based Averitt Express announced July 13 it was raising pay for its less-than-truckload drivers as well as providing a new guaranteed weekly minimum for its regional and flatbed drivers and a shorter waiting period in receiving benefits coverage for its new hires.
XPO Names New Tech Brokerage Company RXO

XPO Logistics’ new tech-enabled brokerage platform that is set to begin operations in the fourth quarter will be called RXO, the company announced July 12.
J.B. Hunt Expedites Overseas Delivery of New Containers

J.B. Hunt Transport Services Inc. has expedited overseas delivery of new containers as part of its commitment to grow intermodal capacity, the company announced June 30.
June 30, 2022Hyliion, Cummins Collaborate on Hypertruck ERX

Hyliion Inc. announced it is collaborating with Cummins Inc. to bring Hyliion’s natural gas extended range powertrain to North American trucking on schedule.
FedEx Predicts Profit Growth Under Three-Year Plan

FedEx Corp. expects to grow earnings per share as much as 19% annually over the next three years by targeting “high-value” customers and squeezing more efficiency out of its networks.
J.B. Hunt, Waymo Add Wayfair to Autonomous Trucking Program

J.B. Hunt Transport Services Inc. and Waymo added the home goods company Wayfair to its autonomous trucking program, the companies announced June 28.
June 28, 2022-

2023
-
2022
-
2021
-
2020
-
2019
-
2018
-
2017
-
2016
-
2015
-
2014
-
2013
-
2012
-
2011
-
2010
-
2009
-
2008
-
2007
-
2006
-
2005
-
2004