
Trailer manufacturer Wabash National Corp. said its third-quarter loss widened but its operating loss declined from the same quarter last year.
November 5, 2009Sponsored by:
2017 Essential Financial and Operating Information for the 50 largest logistics companies in the U.S. and Canada
Up Front
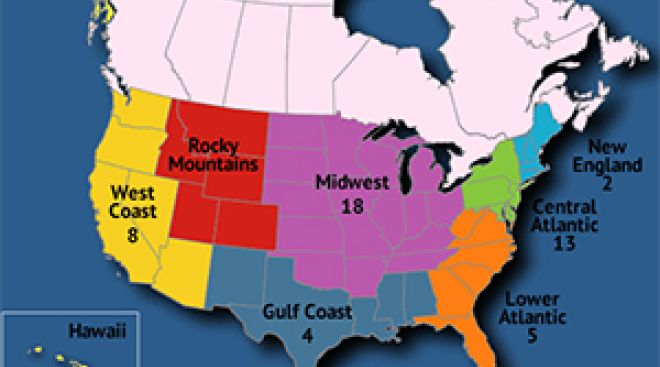
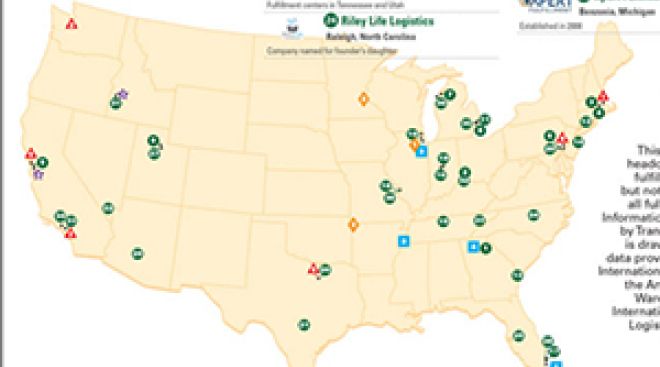
Find out where the carriers are by regions and by state in North America with our interactive map.
Rankings Warehousing
Logistics 50 | Freight Brokerage | Dry Storage Warehousing | Refrigerated Warehousing | Dedicated | Ocean Freight | Airfreight
Top Dry Storage Warehousing Firms
| Rank | Company | Total Space (Millions of Sq.Ft.) | No. of Warehouses |
|---|---|---|---|
| 1 | DHL Supply Chain | 115.0 | 417 |
| 2 | XPO Logistics | 65.0 | 322 |
| 3 | Ryder Supply Chain Solutions | 43.7 | 246 |
| 4 | Geodis (North America) | 42.0 | 140 |
| 5 | Americold Logistics | 38.0 | 145 |
| 6 | FedEx Logistics | 35.0 | 130 |
| 7 | NFI | 31.5 | 90 |
| 8 | Kenco Group | 28.0 | 90 |
| 9 | Lineage Logistics | 26.0 | 114 |
| 10 | UPS Supply Chain Solutions | 26.0 | 304 |
| 11 | DB Schenker (North America) | 23.7 | 91 |
| 12 | DSC Logistics | 23.0 | 63 |
| 13 | Penske Logistics | 20.3 | 80 |
| 14 | Ceva Logistics (North America) | 19.7 | 147 |
| 15 | Atlas Logistics | 18.0 | 594 |
| 16 | Saddle Creek Logistics Services | 17.1 | 75 |
| 17 | DSV A/S (North America) | 16.0 | 50 |
| 18 | Kuehne + Nagel Americas | 15.6 | 83 |
| 19 | APL Logistics (North America) | 14.0 | 35 |
| 20 | Warehouse Services Inc. | 14.0 | 30 |
| 21 | WSI Inc. | 14.0 | 52 |
| 22 | Ingram Micro Commerce & Lifecycle Services | 12.4 | 132 |
| 23 | Radial | 11.8 | 24 |
| 24 | Expeditors International of Washington | 11.5 | 117 |
| 25 | Preferred Freezer Services | 11.0 | 34 |
| 26 | Neovia Logistics | 10.2 | 49 |
| 27 | United States Cold Storage | 9.6 | 37 |
| 28 | Blue Ribbon Transport | 8.3 | 20 |
| 29 | Kane Is Able Inc. | 8.3 | 26 |
| 30 | Performance Team | 7.0 | 22 |
| 31 | Syncreon | 7.0 | 44 |
| 32 | Universal Logistics Holdings | 6.7 | 58 |
| 33 | Legacy Supply Chain Services | 6.5 | 42 |
| 34 | Port Logistics Group | 6.5 | 14 |
| 35 | Technicolor Global Logistics | 6.5 | 12 |
| 36 | WOW Logistics | 6.0 | 19 |
| 37 | Landair | 5.0 | 12 |
| 38 | Reo Logistics | 5.0 | 6 |
| 39 | Shippers Warehouse | 5.0 | 11 |
| 40 | United Facilities | 5.0 | 9 |
| 41 | Verst Group Logistics | 5.0 | 19 |
| 42 | Schneider | 4.5 | 7 |
| 43 | VersaCold Logistics Services | 4.4 | 31 |
| 44 | Wagner Logistics | 4.2 | 15 |
| 45 | D+S Distribution | 4.0 | 21 |
| 46 | LeSaint Logistics | 4.0 | 14 |
| 47 | Xpedient Logistics | 4.0 | 5 |
| 48 | Damco International | 3.9 | 18 |
| 49 | Comprehensive Logistics | 3.8 | 18 |
| 50 | Interstate Warehousing | 3.7 | 7 |
| 51 | Keller Logistics Group | 3.5 | 9 |
| 52 | RGL Logistics | 3.5 | 23 |
| 53 | ODW Logistics | 3.4 | 14 |
| 54 | SCI Group | 3.4 | 26 |
| 55 | Seko Logistics | 3.3 | 100 |
| 56 | Atlanta Bonded Warehouse | 3.2 | 11 |
| 57 | Porteo Group | 3.2 | 27 |
| 58 | Barrett Distribution | 3.0 | 14 |
| 59 | Cardinal Logistics | 3.0 | 29 |
| 60 | Celadon Group | 3.0 | 13 |
| 61 | Laney & Duke Logistics | 3.0 | 4 |
| 62 | Network Global Logistics | 3.0 | 13 |
| 63 | Yusen Logistics | 3.0 | 64 |
| 64 | Cloverleaf Cold Storage | 2.8 | 17 |
| 65 | Pilot Freight Services | 2.8 | 70 |
| 66 | Roadrunner Transportation Systems | 2.8 | 15 |
| 67 | We Pack Logistics | 2.7 | 18 |
| 68 | Burris Logistics | 2.6 | 17 |
| 69 | Crane Worldwide Logistics | 2.5 | 39 |
| 70 | Weber Logistics | 2.5 | 10 |
| 71 | Mallory Alexander International Logistics | 2.4 | 12 |
| 72 | Regal Logistics | 2.4 | 8 |
| 73 | A & R Logistics | 2.2 | 10 |
| 74 | Amware Fulfillment/STACI U.S. | 2.0 | 9 |
| 75 | Commercial Warehouse & Cartage | 2.0 | 8 |
| 76 | Evans Distribution Systems | 2.0 | 11 |
| 77 | Fidelitone | 2.0 | 31 |
| 78 | Henningsen Cold Storage | 2.0 | 10 |
| 79 | Onest Logistics | 2.0 | 29 |
| 80 | The Terminal Corp. | 2.0 | 9 |
| 81 | ACCEL Logistica | 1.9 | 22 |
| 82 | Commercial Warehousing | 1.9 | 16 |
About the Rankings...
Top 50 Logistics Companies provide logistics services, including freight brokerage, freight forwarding, warehousing and dedicated contract carriage in North America and are ranked on the basis of annual gross revenue. Some sector rankings may have been updated since their print publication. To be included in the Top 50 list, please send contact information to tteditor@ttnews.com. We will contact you via phone or e-mail to get information about your company prior to publication of the next Top 50 list.

Extras
If your company appears in the 2017 list, you have a few ways to announce it! Visit our logo library to get web- and print-ready graphics.
53
On the Bubble
SCI Group
($196 million), Toronto, provides dedicated contract carriage, order fulfillment, returned goods management, transportation management and warehousing and distribution.
The growth of e-commerce is giving rise to a new kind of logistic business. Find out why?
Logistics News
Editorial, Business, Logistics
Logistics Scorecard
Consistent with the notion that every cloud has a silver lining, achievers in the logistics business are finding opportunities in difficult times.
November 9, 2009Government, Business, Logistics
Five States Seek $300 Million Federal Grant for Intermodal Development on East Coast
Five states have formed a coalition to seek a $300 million federal grant to help pay for intermodal development and improvements along the Norfolk Southern Railroad corridor that stretches from New Orleans to New York City.
November 9, 2009Business, Logistics
BirdDog Logistics Acquires Churchill Transport
Freight broker BirdDog Logistics Services said that it has acquired Churchill Transport Group, a third-party logistics firm.
November 6, 2009Business, Logistics
J.B. Hunt, Norfolk Southern Set Intermodal Deal
J.B. Hunt Transport Services said that it has reached a multi-year deal with Norfolk Southern Corp. in which the railroad will provide intermodal service for the carrier in the eastern U.S.
November 6, 2009Business, Logistics

Wabash National’s 3Q Operating Loss Narrows
Business, Safety, Government, Logistics
Pacer’s 3Q Profit Falls
Transportation and third-party logistics firm Pacer International said its third-quarter profit fell to $600,000, or 2 cents per share, compared with $20.8 million, or 59 cents, a year earlier.
November 4, 2009Government, Business, Logistics
Expeditors’ Third-Quarter Income Falls 33%
Logistics firm Expeditors International of Washington said Tuesday its third-quarter net income fell 33% to $57.8 million, or 27 cents a share, from $85.6 million, or 39 cents, a year ago.
November 3, 2009Business, Logistics, Equipment
Wabash to Close Illinois Plant
Trailer maker Wabash National Corp. said Tuesday that it will sell its Anna, Ill., plant and consolidate operations into its Cadiz, Ky., plant.
November 3, 2009Fuel, Business, Logistics, Government

Diesel Gains 0.7¢ to $2.808 a Gallon as Increases Slow
Diesel fuel’s national average retail price rose for a fourth straight week, though its increase slowed from recent weeks in a 0.7 cent gain to $2.808 a gallon, the Department of Energy said Monday.
November 3, 2009Government, Business, Logistics
State Coalition Seeks Fed Aid for Intermodal Terminals
Five states have formed a coalition to seek a federal grant to build intermodal terminals and make other improvements along the Norfolk Southern Railroad line stretching from New Orleans to New York City.
November 2, 2009Archives
-

2023
-
2022
-
2021
-
2020
-
2019
-
2018
-
2017
-
2016
-
2015
-
2014
-
2013
-
2012
-
2011
-
2010
-
2009
-
2008
-
2007
-
2006
-
2005