Top 100 Private | Food Service | Grocery | Beverage | Petroleum/Chemical | Industrial Gases | Agriculture/Food Processing | Wholesale/Retail | Manufacturing
Equipment Rental | Building Materials | Waste Management | Paper/Office Products | Construction | Health Care | Uniform Rental | Media & Entertainment
| Rank This Year | Rank Last Year | Company | Tractors | Trucks | Pickups/ Cargo Vans | Trailers | Annual Revenue |
|---|---|---|---|---|---|---|---|
| 1 | 1 | PepsiCo Inc. |
11,100 | 3,500 | 20,600 | 17,500 | $63.5 billion |
| 2 | 2 | Sysco Corp. |
8,577 | 1,202 | - | 10,696 | $55.4 billion |
| 3 | 3 | Walmart Inc. |
6,472 | 145 | - | 61,640 | $500.3 billion |
| 4 | 6 | Reyes Holdings |
5,443 | 804 | 1,250 | 6,659 | $26.5 billion |
| 5 | 7 | Halliburton Co. |
5,382 | 2,885 | 254 | 10,362 | $20.6 billion |
| 6 | 5 | U.S. Foods |
5,336 | 389 | - | 6,650 | $24.0 billion |
| 7 | 8 | Nutrien |
4,349 | 2,261 | 8,622 | 8,554 | $13.7 billion |
| 8 | 9 | McLane Co. |
3,941 | 135 | 31 | 5,750 | - |
| 9 | 11 | Schlumberger Limited |
3,652 | 517 | 249 | 5,107 | $30.4 billion |
| 10 | 12 | Performance Food Group |
2,835 | 214 | - | 3,810 | $16.8 billion |
| 11 | 13 | Tyson Foods |
2,819 | 40 | 1,390 | 7,329 | $38.3 billion |
| 12 | 14 | Keurig Dr Pepper |
2,331 | 86 | 538 | 2,749 | $6.4 billion |
| 13 | 10 | C & J Energy Services |
2,306 | 454 | - | 3,715 | $1.6 billion |
| 14 | 20 | Basic Energy Services |
1,686 | 386 | - | 1,819 | $0.9 billion |
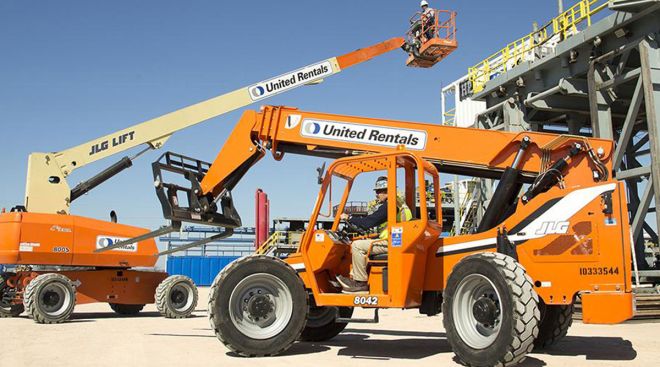
| 15 | 24 | United Rentals Inc. |
1,673 | 3,069 | - | 1,291 | $6.6 billion |
| 16 | 18 | CHS Inc. |
1,595 | 2,002 | - | 11,247 | $31.9 billion |
| 17 | 19 | Gordon Food Service |
1,519 | 17 | - | 2,041 | - |
| 18 | 17 | American Air Liquide Holdings |
1,472 | 4,184 | - | 2,331 | $23.7 billion |
| 19 | 23 | Albertsons Cos. |
1,450 | 1,030 | 75 | 5,300 | $59.9 billion |
| 20 | 44 | Coca-Cola Bottling Co. United |
1,427 | 513 | - | 1,915 | - |
| 21 | 25 | Clean Harbors Inc. |
1,375 | 5,187 | 21 | 4,361 | $2.9 billion |
| 22 | 26 | Dot Foods |
1,353 | 5 | 18 | 2,190 | - |
| 23 | 31 | The Quikrete Cos. |
1,248 | 47 | - | 1,899 | - |
| 24 | 27 | Gibson Energy Inc. |
1,200 | - | - | 2,500 | $6.1 billion |
| 25 | 30 | Sunbelt Rentals |
1,191 | 2,681 | - | 1,524 | $4.2 billion |
| 26 | - | FTS International |
1,116 | 178 | - | 1,485 | $1.5 billion |
| 27 | 41 | Core-Mark Holding Co. |
1,108 | 134 | - | 1,469 | $15.7 billion |
| 28 | 28 | Calfrac Well Services |
1,102 | 364 | - | 1,751 | $1.5 billion |
| 28 | 21 | Femsa Logistica |
1,102 | 1,100 | - | 2,130 | - |
| 30 | 37 | Ben E. Keith Co. |
1,066 | 82 | - | 1,333 | - |
| 31 | 57 | Ahold USA/Delhaize America |
1,062 | 714 | - | 4,560 | $44.5 billion |
| 32 | 33 | Pilot Flying J Inc. |
1,061 | 35 | - | 1,405 | - |
| 33 | 35 | Cemex USA |
1,030 | 3,354 | - | 1,689 | $3.5 billion |
| 34 | 32 | Praxair Inc. |
1,021 | 1,518 | - | 3,188 | $11.4 billion |
| 35 | 36 | Helena Chemical Co. |
1,004 | 2,507 | - | 2,575 | - |
| 36 | 43 | United Natural Foods |
943 | 6 | - | 1,084 | $9.3 billion |
| 37 | 39 | Builders FirstSource Inc. |
940 | 2,312 | - | 1,639 | $7.0 billion |
| 38 | 45 | Walgreen Co. |
920 | 24 | - | 2,387 | $118.2 billion |
| 39 | 69 | Maxim Crane Works |
903 | 99 | - | 1,428 | - |
| 40 | 22 | The Kroger Co. |
879 | 35 | - | 11,211 | $122.7 billion |
| 41 | 48 | Ashley Furniture Industries |
870 | 7 | - | 3,710 | - |
| 42 | 97 | BlueLinx Holdings |
836 | 47 | - | 881 | $1.8 billion |
| 42 | 38 | Veritiv Corp. |
836 | 97 | 149 | 1,415 | $8.4 billion |
| 44 | 34 | Darling Ingredients Inc. |
835 | 930 | 355 | 4,077 | $3.7 billion |
| 45 | 40 | Key Energy Services |
790 | 805 | - | 6,034 | $0.4 billion |
| 46 | 73 | Mondelez International |
779 | 106 | - | 996 | $26.0 billion |
| 47 | 16 | Dean Foods Co. |
765 | 761 | - | 2,262 | $7.8 billion |
| 48 | 47 | Prairie Farms Dairy |
761 | 1,218 | - | 2,431 | $3.0 billion |
| 49 | 54 | ABC Supply Co. |
750 | 2,400 | 262 | 1,000 | - |
| 50 | 53 | Love's Travel Stops & Country Stores |
740 | - | - | 780 | - |
| 50 | 49 | Univar Inc. |
740 | 125 | - | 1,775 | $8.3 billion |
| 52 | 42 | Plains All American Pipeline |
730 | - | - | 900 | $26.0 billion |
| 53 | 61 | Shaw Industries Group |
725 | 60 | - | 3,210 | - |
| 54 | 46 | Food Services of America |
714 | 50 | - | 820 | - |
| 55 | 52 | Southern Glazer's Wine and Spirits |
702 | 2,203 | - | 1,118 | - |
| 56 | 59 | Supervalu Inc. |
694 | 5 | - | 2,637 | $14.2 billion |
| 57 | 75 | SE Independent Delivery Services |
691 | 103 | - | 1,202 | - |
| 58 | 80 | Bunzl Distribution USA |
686 | - | 37 | 1,168 | $6.5 billion |
| 59 | 83 | Beacon Roofing Supply |
682 | 1,436 | - | 1,168 | $4.4 billion |
| 60 | 68 | Golden State Foods |
681 | 33 | - | 877 | $7.0 billion |
| 61 | 55 | Advanced Drainage Systems |
675 | - | - | 1,200 | $1.3 billion |
| 62 | - | Coca-Cola Bottling Co. of Northern New England |
672 | 100 | - | 890 | - |
| 63 | 56 | Swire Coca-Cola USA |
669 | 242 | - | 801 | $1.8 billion |
| 64 | 60 | Sherwin-Williams Co. |
667 | 1 | - | 1,670 | $15.0 billion |
| 65 | 50 | Anheuser-Busch Cos. |
666 | 133 | - | 773 | - |
| 66 | 65 | JBS USA Holdings |
665 | - | - | 1,430 | $26.8 billion |
| 67 | 62 | Publix Super Markets |
659 | 18 | 414 | 3,265 | $34.6 billion |
| 68 | 58 | Shamrock Foods |
655 | 75 | 75 | 1,098 | - |
| 69 | 98 | Select Energy Services |
653 | 630 | - | 1,763 | $0.7 billion |
| 70 | 63 | Cudd Energy Services |
638 | 239 | - | 881 | - |
| 71 | - | ProPetro Holding Corp. |
630 | 43 | - | 773 | $1.0 billion |
| 72 | - | Liberty Coca-Cola Beverages |
620 | 231 | - | 768 | - |
| 73 | 66 | Energy Transfer Partners |
605 | 95 | - | 712 | $29.0 billion |
| 74 | 71 | Archer Daniels Midland (ADM) Co. |
602 | 87 | - | 1,702 | $60.8 billion |
| 75 | - | Coca-Cola Beverages Florida |
598 | 14 | - | 657 | - |
| 76 | 78 | Air Products Inc. |
589 | 94 | 330 | 2,000 | $8.2 billion |
| 77 | 64 | Brenntag North America |
587 | 80 | - | 1,487 | - |
| 78 | 74 | Nestle USA |
581 | 3,353 | - | 1,435 | $26.7 billion |
| 79 | - | Williams Brothers Construction |
575 | 200 | - | 253 | - |
| 80 | 15 | Baker Hughes |
571 | 63 | - | 355 | $22.0 billion |
| 81 | 77 | C&S Wholesale Grocers |
567 | - | - | 1,613 | - |
| 82 | 79 | MDU Resources Group Inc. |
563 | 1,797 | - | 1,844 | $4.4 billion |
| 83 | 80 | Stericycle Inc. |
556 | 3,762 | - | 2,095 | $3.6 billion |
| 84 | 82 | Foster Farms |
536 | 96 | 10 | 1,621 | - |
| 85 | 84 | Gravity Oilfield Services |
529 | 69 | - | 541 | - |
| 86 | 76 | H.E.B. Grocery Co. |
517 | 5 | - | 2,355 | - |
| 87 | 85 | Linde North America |
508 | 1,877 | - | 1,421 | - |
| 88 | 87 | Mohawk Industries |
488 | 159 | - | 2,217 | $9.5 billion |
| 89 | 90 | Ace Hardware Corp. |
469 | 1 | 1 | 1,440 | $5.4 billion |
| 90 | 88 | Valley Proteins Inc. |
466 | 151 | 54 | 1,198 | - |
| 91 | - | Medline Inc. |
462 | 121 | - | 547 | $10.0 billion |
| 92 | 72 | Oldcastle Inc. |
460 | 894 | 2 | 1,266 | - |
| 93 | 100 | Herc Rentals |
444 | 300 | - | 447 | $1.8 billion |
| 94 | 91 | Pepsi Bottling Ventures |
441 | 141 | 176 | 609 | - |
| 94 | 93 | The H.T. Hackney Co. |
441 | 172 | - | 578 | - |
| 96 | 89 | KeHE Distributors |
438 | 1 | 1 | 742 | - |
| 97 | 92 | Sanderson Farms Inc. |
436 | 31 | - | 706 | $3.3 billion |
| 98 | 94 | Bragg Cos. |
433 | - | - | 682 | - |
| 98 | 67 | Nuverra Environmental Solutions |
433 | 180 | - | 553 | $0.2 billion |
| 100 | 95 | Dunkin' Brands Group |
430 | 12 | - | 450 | $0.9 billion |
The Top 100 Private Carriers on this list operate their own trucks to carry freight and are ranked on the basis of the total number of highway tractors in the fleet. To be included in the Top 100 list, please send contact information to tteditor@ttnews.com. We will contact you via phone or e-mail to get information about your company prior to publication of the next Top 100 list.
On the Bubble
FTC Says Amazon Enrolls Consumers Into Prime Without Consent
NEW YORK — The Federal Trade Commission sued Amazon on June 21 for what it called a yearslong effort to enroll consumers without consent into its Prime program.
Amazon Debuts ‘HQ2’ Complex in Virginia
ARLINGTON, Va. — Amazon unveiled its new headquarters complex in Virginia June 15, a pair of gleaming amenity-packed towers that leaders hope will persuade employees to return to the office.
Walmart Announces Sustainability Initiatives
Walmart announced June 1 it will take steps to reduce the amount of plastic and cardboard it puts in the waste stream from online orders and reduce vehicle emissions from delivery of packages.
NLRB Accuses Amazon of Illegal Anti-Union Actions
Amazon.com Inc. violated federal labor law by unilaterally changing policies and terminating union supporters at its sole unionized warehouse, U.S. labor board prosecutors allege.
Walmart Stock Outperforms Target
Walmart shares are outshining those of Target as Wall Street anticipates the shopping behemoth’s broad array of household necessities will offer shelter from slowing economic growth.
Walmart Boosts Outlook After a Strong First Quarter
NEW YORK — Walmart reported a strong first quarter and boosted its outlook for the year as the nation’s largest retailer continues to draw budget-conscious consumers.
Kroger CEO Vows Legal Fight for Albertsons Deal if Necessary
Kroger Co. said it’s committed to hunkering down for a long legal battle if U.S. regulators attempt to block its $24.6 billion acquisition of Albertsons Cos.
Infrastructure Spending Expected to Benefit United Rentals
United Rentals executives foresee a rosy outlook for the business and sector as a result of increased infrastructure spending in the coming months and years after posting increased year-over-year profits in the first three months of 2023, they said April 27.
Amazon Contract Drivers in California Join Teamsters Union
More than 80 contract drivers and dispatchers who handle deliveries for Amazon .com Inc. have joined the International Brotherhood of Teamsters.
Amazon May Charge a Return Fee at UPS Stores
If you opt to return your Amazon purchase at a UPS store, that transaction just might cost you.


