Soft market conditions in 2023 placed financial strain on many of the largest trucking companies in North America.
Trucking companies have been surviving on lower rates while awaiting a freight market recovery.
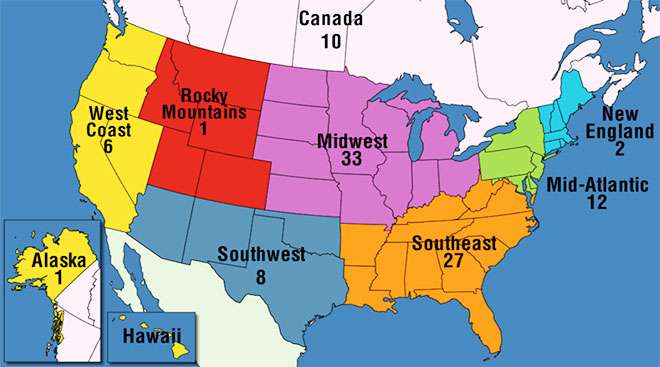
Find out where the Top 100 For-Hire carriers are located by region; click links to view details about the company.
| Rank This Year | Rank Last Year | Company | Revenue (000) | Net Income (000) | Employees | Tractors* | Trailers |
|---|---|---|---|---|---|---|---|
| 1 | 1 | 90,958,000 | 6,708,000 | 500,000 | 19,267 | 84,956 | |
| 2 | 2 | 87,514,000 | 4,395,000 | 529,000 | 38,697 | 138,230 | |
| 3 | 3 | 12,829,665 | 728,287 | 35,000 | 23,000 | 47,400 | |
| 4 | 4 | 9,090,567 est |
504,877 | 25,123 | 7,504 | 34,599 | |
| 5 | 5 | 7,744,000 | 189,000 | 38,000 | 9,500 | 33,500 | |
| 6 | 9 | 7,660,000 est |
- | 47,500 | 69,000 | 40,800 | |
| 7 | 7 | 7,141,766 | 217,149 | 34,300 | 24,788 | 96,347 | |
| 8 | 10 | 5,866,152 | 1,239,502 | 23,386 | 10,791 | 46,414 | |
| 9 | 8 | 5,498,900 | 238,500 | 17,300 | 10,600 | 47,300 | |
| 10 | 6 | 5,303,322 | 264,394 | 1,468 | 9,809 | 18,017 | |
| 11 | 14 | 5,073,000 | - | 22,803 | 10,033 | 41,368 | |
| 12 | 12 | 4,427,443 | 142,164 | 15,000 | 4,411 | 24,323 | |
| 13 | 15 | 4,300,000 | - | 21,173 | 7,287 | 21,979 | |
| 14 | 11 | 4,202,585 | 167,528 | 5,950 | 5,200 | 4,300 | |
| 15 | 16 | 3,500,000 | - | 17,300 | 4,850 | 13,700 | |
| 16 | 17 | 3,283,499 | 112,382 | 13,809 | 8,035 | 30,810 | |
| 17 | 18 | 3,070,000 est |
- | 8,284 | 20,468 | ||
| 18 | 21 | 2,881,433 | 354,857 | 14,000 | 6,500 | 22,100 | |
| 19 | 20 | 2,653,000 | 296,000 | 14,000 | 552 | 1,073 | |
| 20 | 19 | 2,520,027 | 368,654 | 4,535 | 8,112 | 15,735 | |
| 21 | 22 | 2,406,635 | - | 10,000 | 7,550 | 12,600 | |
| 22 | 23 | 2,040,000 | - | 630 | 7,500 | ||
| 23 | 34 | 1,706,219 | - | 5,000 | 3,782 | 10,302 | |
| 24 | 32 | 1,686,340 | - | 8,592 | 2,924 | 8,426 | |
| 25 | 29 | 1,668,000 est |
- | 9,309 | 5,255 | 15,774 | |
| 25 | 26 | 1,668,000 est |
- | 6,224 | 4,778 | ||
| 27 | 25 | 1,662,139 | 92,901 | 9,311 | 4,206 | 4,892 | |
| 28 | 33 | 1,569,780 est |
- | 3,600 | 3,950 | 6,400 | |
| 29 | 39 | 1,529,000 | - | 8,258 | 1,537 | 9,854 | |
| 30 | 35 | 1,525,716 est |
- | 1,234 | |||
| 31 | 30 | 1,511,300 | - | 2,379 | 2,443 | 6,891 | |
| 32 | 38 | 1,342,000 | - | 6,500 | 5,538 | 13,170 | |
| 33 | 40 | 859,429 | - | 2,940 | 2,200 | 150 | |
| 34 | 36 | 1,282,000 | - | 616 | 3,900 | ||
| 35 | 44 | 1,261,000 est |
- | 2,953 | 11,877 | ||
| 36 | 58 | 1,207,458 | 14,775 | 6,320 | 5,512 | 16,833 | |
| 37 | 41 | 1,193,400 est |
- | 2,519 | 1,088 | 3,348 | |
| 38 | 42 | 1,131,455 | 70,373 | 4,213 | 3,349 | 5,653 | |
| 39 | 43 | 1,127,348 | - | 1,215 | 3,499 | 3,345 | |
| 40 | 46 | 1,103,573 | 55,229 | 4,904 | 2,458 | 4,808 | |
| 41 | 27 | 1,096,958 | 167,351 | 4,014 | 989 | 6,637 | |
| 42 | 28 | 1,089,000 est |
- | 6,500 | 3,996 | 5,544 | |
| 43 | 48 | 1,057,251 | - | 3,050 | 4,300 | ||
| 44 | 50 | 1,054,000 est |
- | 5,300 | 3,550 | 9,200 | |
| 45 | 56 | 1,035,000 est |
- | 5,800 | 2,261 | 5,223 | |
| 46 | 49 | 1,003,153 | - | 4,486 | 2,600 | 9,400 | |
| 47 | 37 | 989,259 | 101,259 | 4,621 | 2,354 | 6,549 | |
| 48 | 55 | 962,180 est |
- | 5,583 | 3,500 | 5,000 | |
| 49 | 60 | 944,742 | - | 5,424 | 1,654 | 4,145 | |
| 50 | 53 | 904,600 | 2,000 | 637 | 1,679 | 3,754 | |
| 51 | 57 | 903,312 est |
- | 3,000 | 2,035 | 5,782 | |
| 52 | 54 | 886,000 | - | 783 | 1,020 | 1,508 | |
| 53 | 62 | 814,000 | 118,900 | 3,650 | 2,400 | 4,100 | |
| 54 | 61 | 810,807 | 18,416 | 2,530 | 2,200 | 8,567 | |
| 55 | 45 | 808,000 est |
- | 2,624 | 3,152 | 5,250 | |
| 56 | 67 | 795,000 | - | 3,200 | 2,500 | 2,345 | |
| 57 | 66 | 774,000 | - | 4,120 | 1,763 | 2,924 | |
| 58 | 758,000 est |
- | |||||
| 59 | 65 | 744,000 est |
- | 3,500 | 2,519 | 3,402 | |
| 60 | 64 | 736,236 est |
- | 1,837 | 1,797 | 1,915 | |
| 61 | 76 | 676,000 est |
- | 3,681 | 4,429 | ||
| 62 | 59 | 674,500 | - | 3,500 | 2,897 | 4,608 | |
| 63 | 68 | 670,079 | - | 2,325 | 2,392 | 7,666 | |
| 64 | 69 | 664,000 | - | 2,262 | 1,899 | 3,425 | |
| 65 | 70 | 647,000 est |
- | 266 | 2,093 | 2,093 | |
| 66 | 609,000 est |
- | 3,700 | 3,076 | 11,683 | ||
| 67 | 71 | 574,668 est |
- | 3,400 | 2,200 | 5,000 | |
| 68 | 73 | 574,000 est |
- | 2,933 | 2,166 | 5,820 | |
| 69 | 83 | 556,975 | - | 1,585 | 1,480 | 3,134 | |
| 70 | 74 | 547,128 est |
- | 2,000 | 2,000 | ||
| 71 | 75 | 531,522 est |
- | 2,000 | 1,286 | 1,284 | |
| 72 | 78 | 468,180 est |
- | 450 | 1,500 | ||
| 73 | 72 | 446,000 est |
- | 2,000 | 1,600 | 5,600 | |
| 74 | 63 | 443,000 est |
- | 2,043 | 6,300 | ||
| 75 | 85 | 425,089 | - | 619 | 1,199 | 2,011 | |
| 76 | 79 | 423,433 est |
- | 2,173 | 1,645 | 2,763 | |
| 77 | 80 | 415,120 est |
- | 260 | 550 | 650 | |
| 78 | 88 | 410,000 est |
- | 1,250 | 352 | 2,042 | |
| 79 | 81 | 403,002 est |
- | 1,485 | 576 | 1,147 | |
| 80 | 84 | 390,150 est |
- | 900 | 2,000 | ||
| 81 | 87 | 374,000 est |
- | 400 | 158 | 575 | |
| 82 | 357,000 | - | 600 | 640 | 1,300 | ||
| 83 | 82 | 349,442 | - | 1,754 | 1,596 | 2,420 | |
| 84 | 92 | 332,000 | - | 1,150 | 1,005 | 1,900 | |
| 85 | 91 | 331,258 est |
- | 930 | 616 | 1,000 | |
| 86 | 330,000 | - | 1,404 | 687 | 1,423 | ||
| 87 | 86 | 323,556 | 187,260 | 1,225 | 615 | 1,805 | |
| 88 | 94 | 320,000 est |
- | 1,700 | 800 | 2,400 | |
| 89 | 93 | 312,933 est |
- | 509 | 757 | 3,400 | |
| 90 | 95 | 305,694 est |
- | 1,500 | 4,000 | ||
| 91 | 96 | 301,222 est |
- | 1,300 | 1,200 | 4,600 | |
| 92 | 97 | 290,822 est |
- | 1,200 | 1,897 | 2,068 | |
| 93 | 98 | 264,906 | - | 1,095 | 750 | 3,340 | |
| 94 | 253,000 est |
- | 1,600 | 600 | |||
| 95 | 248,467 | - | 1,350 | 849 | 623 | ||
| 96 | 100 | 232,529 est |
- | 588 | 653 | 1,250 | |
| 97 | 207,000 | - | 1,090 | 850 | 2,200 | ||
| 98 | 204,698 | 6,141 | 1,288 | 1,150 | 2,696 | ||
| 99 | 198,166 | -1,324 | 1,315 | 702 | 1,620 | ||
| 100 | 182,415 | 13,426 | 1,800 | 119 | 295 |
Top For-Hire Carriers on this list are common and contract freight carriers operating in the United States, Canada and Mexico. Companies are ranked on the basis of annual revenue. To be included in the Top 100 or any of the sectors, please send contact information to tteditor@ttnews.com. We will contact you via phone or e-mail to get information about your company prior to publication of the next Top 100 list.
* Tractor count includes company-owned, lease-to-own and owner-operator tractors.
#2 FedEx Corp. revenue and net income is for the 12-month period ended Feb. 29, 2024.
#4 TFI’s revenue is adjusted to reflect its acquisition of Daseke Inc. in April 2024.
#6 Ryder’s revenue is adjusted to reflect its acquisition of Cardinal Logistics in February 2024.
#33 IMC Logistics revenue data was provided by the company to replace the previously published estimate that determined its ranking on the Top 100 list.
#47 Mullen Group revenue and income converted to U.S. dollars based on average 2023 exchange rate.
#48 10 Roads Express revenue estimate is based on data provided by Culhane Meadows.
#28 PS Logistics, #30 OnTrac Inc., #37 Lynden, #51 Quality Carriers, #60 United Road Services, #67 Trimac Transportation, #70 Heniff, #71 Jack Cooper Holdings, #72 ContainerPort Group, #76 Maverick USA, #77 Beemac Trucking, #79 Dependable Supply Chain Services, #80 Koch Cos., #89 Artur Express, #90 Western Flyer Express, #91 New Legend, #92 Transervice Logistics and #96 National Carriers revenues are estimated by Transport Topics based on prior-year data and industry revenue trends.
#17 R+L Carriers, #25 CRST, #35 Central Transport International, #58 Manitoulin Group of Cos., #61 TMC Transportation, #65 Mercer Transportation, #66 FirstFleet and #68 Roehl Transport revenues are estimated by SJ Consulting Group.
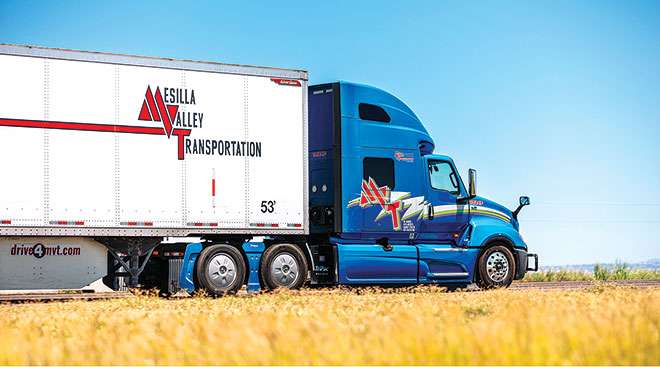
#25 Averitt Express, #42 C.R. England, #45 Dayton Freight Lines, #55 Hirschbach Motor Lines, #59 Canada Cartage, #73 Mesilla Valley Transportation, #74 USA Truck, #78 Roadrunner Freight, #81 Daylight Transport, #88 Oak Harbor Freight Lines and #94 Ward Transport & Logistics revenue estimates are based on data provided by SJ Consulting Group.
The regional LTL carrier has adapted and expanded through a full century of economic cycles and industry changes.
The trucking industry remains mired in sustained overcapacity relative to freight demand even as it has slowly shed workers.
After being displaced by war in his native Sudan, Lual Akoon’s path took him to Middle America – and trucking.
If your company appears on the list, you have a few ways to announce it. Visit our logo library to get ready-made graphics.
For-hire carriers across segments saw revenues slide and margins tighten, but some fared better than others.
Learn more about how companies are selected for Transport Topics' Top 100 largest for-hire carriers list.
Ongoing Truckload Weakness, Helene Hurt P.A.M. Q3 Profit
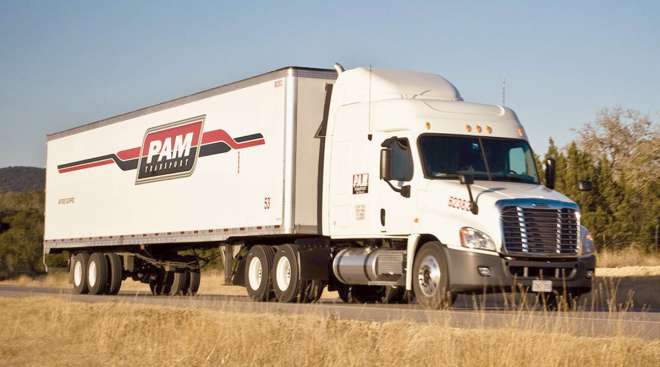
Profits at P.A.M. Transport slumped 61% in the third quarter of 2024 on the back of continued truckload market weakness and the impact of Hurricane Helene.
Forward Air Revenue Soars 92%; Net Loss Hits $34M
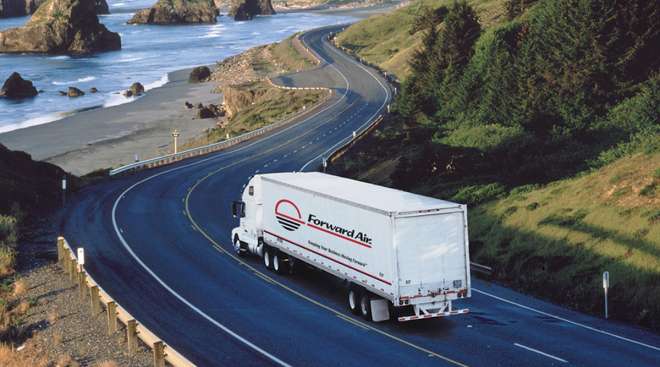
The Tennessee-based ground transportation and logistics services provider posted a net loss of $34.2 million, or negative $2.62 a diluted share, for the three months ending Sept. 30.
Retailers Offer ‘Returnless Refunds’ to Reduce Shipping Fees
Returnless refunds are a tool that more retailers are using to keep online shoppers happy and to reduce shipping fees, processing time and other ballooning costs from returned products.
Werner Revenue and Profit Decline on Q3 Market Struggles
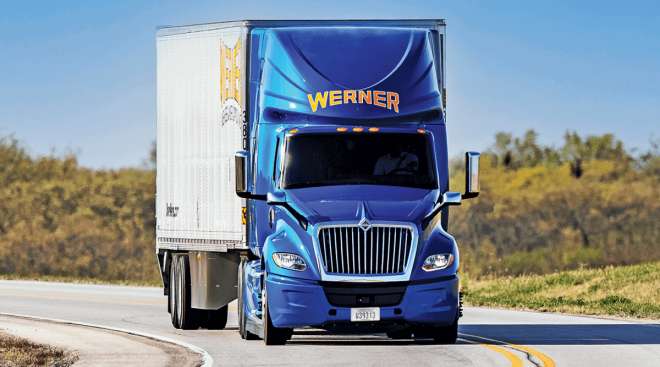
The Omaha, Neb.-based carrier’s Q3 net income fell 72% to $6.6 million, or 11 cents per share, compared with $23.7 million, 37 cents, a year ago.
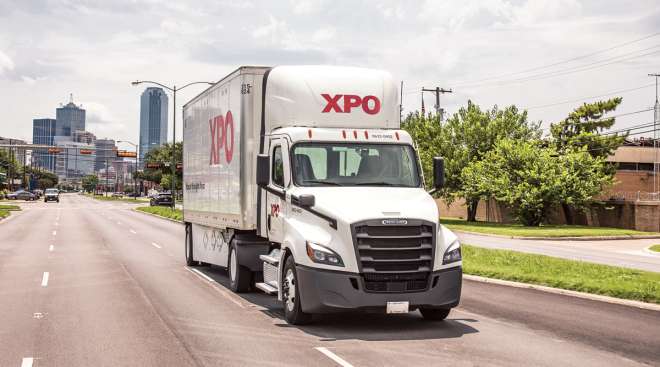
October 30, 2024XPO Net Income Climbs 10% on Strong LTL Pricing in Q3
XPO’s North American LTL segment, its core operation, increased revenue by 1.9% to $1.25 billion from $1.23 billion last year despite declines in shipment volumes.
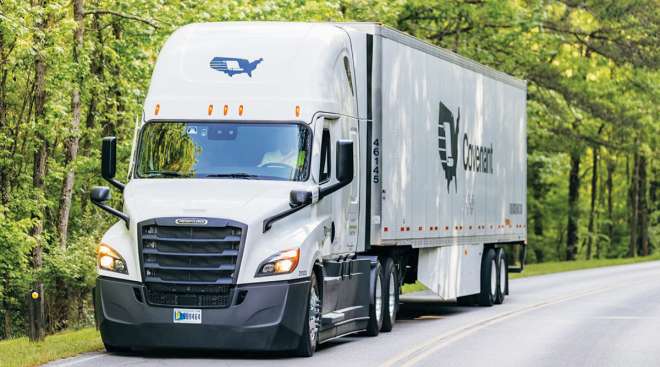
October 30, 2024Covenant's Q3 Net Income and Revenue Take Slight Dips
The company reported third-quarter net income of $13 million, or 94 cents per share, compared with $13.5 million, 99 cents, in the year-ago period.
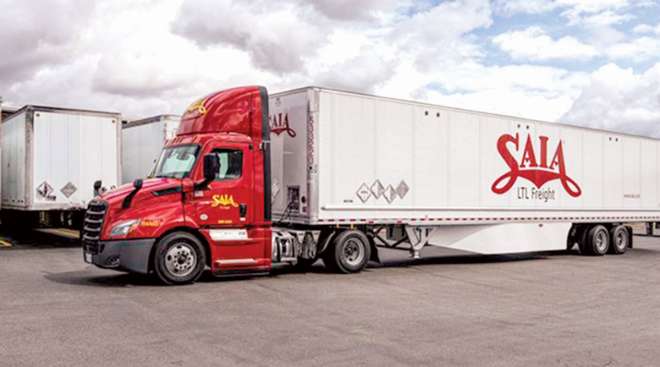
October 29, 2024Saia Reports Q3 Revenue Growth Amid Network Expansion
Saia Inc. reported Oct. 25 that it was able to post record-high third-quarter revenue amid an ongoing effort to expand its operational footprint.
Anchorage’s International Airport Adds 5 Carriers
The Ted Stevens Anchorage International Airport has added five new international cargo carriers to its lineup this year, setting the stage for continued growth.
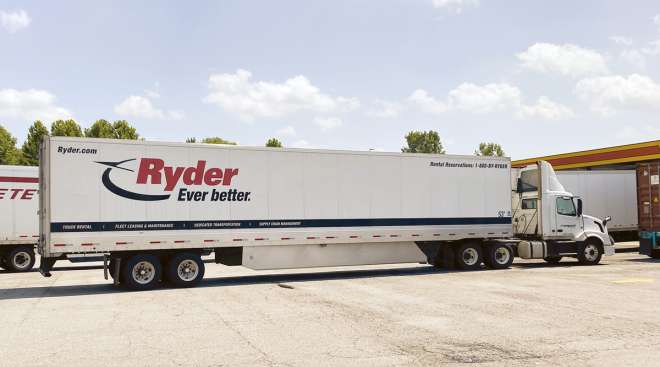
Ryder Q3 Profit Slides Even as Acquisitions Boost Revenue
Looking forward, Chief Financial Officer John Diez said Ryder expects earnings growth in the fourth quarter as a result of its contractual portfolio.
Mullen Group Q3 Earnings Dip Despite Revenue Growth
The Okotoks, Alberta-based company posted net income of C$38.3 million, or 41 cents a diluted share, for the three months ending Sept. 30.


