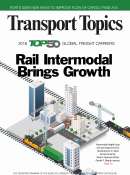
2022 Essential Revenue and Operating Information for the 50 Largest Global Freight Companies
Up Front

Supply chain disruptions may be easing, but freight volumes continue to stir anxiety in shippers.

Non-asset based companies join the field in this year’s Global Freight Top 50 list.

Get a continent-by-continent and country-by-country look at where the Top 50 Global Freight Companies are based.
Rankings
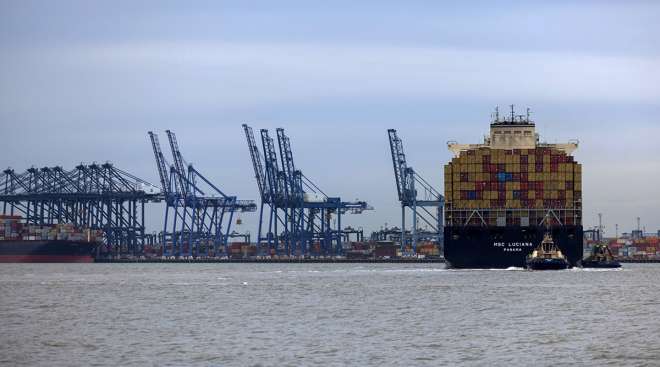
Port Data
| Rank | Port Name | City | Type of Freight | TEUs 2021 | TEUs 2020 | % Change | Freight Tonnage (metric tons) |
|---|---|---|---|---|---|---|---|
| 1 | Port of Los Angeles * | Los Angeles | container, break bulk, dry bulk, liquid bulk, automotive, heavy lift, special project cargo, refrigerated, passenger | 10,677,610 | 9,213,396 | 15.9% | 222,000,000 |
| 2 | Port of Long Beach | Long Beach, Calif. | container, break bulk, dry bulk, liquid bulk, automotive, heavy lift, special project cargo, refrigerated, passenger | 9,384,368 | 8,113,315 | 15.7% | 196,386,014 |
| 3 | Port of New York and New Jersey ^ | New York | container, break bulk, dry bulk, liquid bulk, automotive, heavy lift, special project cargo, refrigerated, passenger | 8,985,929 | 7,585,819 | 18.5% | 112,216,428 |
| 4 | Port of Savannah ^ | Savannah, Ga. | container, break bulk, heavy lift, automobile, refrigerated | 5,613,163 | 4,682,249 | 19.9% | 39,419,938 |
| 5 | Ports of Colon, Cristobal and Manzanillo ** | Colón, Panama | container, liquid bulk, dry bulk, passenger, transshipping | 4,915,975 | 4,454,902 | 10.3% | |
| 6 | Northwest Seaport Alliance | Seattle and Tacoma, Wash. | container, break bulk, liquid bulk, dry bulk, automobile, heavy lift, special project cargo, refrigerated, passenger, air cargo | 3,736,206 | 3,320,379 | 12.5% | 27,363,475 |
| 7 | Port of Vancouver | Vancouver, British Columbia | container, break bulk, dry bulk, liquid bulk, automobile, special project cargo, passenger | 3,678,952 | 3,467,521 | 6.1% | |
| 8 | Port of Balboa/PSA Panama International Terminal | Panama Int'l Terminals, Panama | container, transshipping | 3,561,432 | 3,161,658 | 12.6% | |
| 9 | Port of Virginia | Norfolk, Va. | container, break bulk, dry bulk, liquid bulk, automobile | 3,522,834 | 2,813,415 | 25.2% | 55,797,100 |
| 10 | Port Houston | Houston | container, break bulk, dry bulk, liquid bulk | 3,453,226 | 3,001,164 | 15.1% | 40,399,937 |
| 11 | Port of Manzanillo | Manzanillo, Colima, Mexico | container, dry bulk, liquid bulk | 3,371,438 | 2,909,632 | 15.9% | 35,024,782 |
| 12 | Port of Charleston ^ | Charleston, S.C. | container, break bulk, dry bulk, automobile, refrigerated | 2,751,442 | 2,309,995 | 19.1% | 22,631,975 |
| 13 | Port of Oakland ^ | Oakland, Calif. | container | 2,448,243 | 2,461,262 | -0.5% | 17,635,455 |
| 14 | Port of Kingston | Kingston, Jamaica | container, heavy lift, liquid bulk | 1,975,401 | 1,611,637 | 22.6% | |
| 15 | Port of Montreal | Montreal | container, break bulk, dry bulk, liquid bulk, passenger | 1,728,114 | 1,600,000 | 8.0% | 34,023,135 |
| 16 | Port of Lázaro Cárdenas | Lázaro Cárdenas, Michoacán, Mexico | container, break bulk, dry bulk, liquid bulk | 1,686,076 | 1,063,675 | 58.5% | |
| 17 | Port of Freeport | Freeport, Bahamas | container, passenger | 1,642,780 | 1,231,703 | 33.4% | |
| 18 | Port of San Juan ^ | San Juan, Puerto Rico | container | 1,438,738 | 1,490,218 | -3.5% | 8,470,533 |
| 19 | Port of Jacksonville *** | Jacksonville, Fla. | container, break bulk, dry bulk, liquid bulk, automobile, heavy lift, refrigerated | 1,407,310 | 1,277,161 | 10.2% | 9,378,906 |
| 20 | Moín Container Terminal | Límon, Costa Rica | container | 1,319,372 | 1,213,431 | 8.7% | |
| 21 | Port Miami *** | Miami | container, passenger | 1,254,062 | 1,066,738 | 17.6% | 10,114,409 |
| 22 | Port of Veracruz | Veracruz, Veracruz, Mexico | container, dry bulk, liquid bulk, automobile | 1,165,043 | 1,005,936 | 15.8% | |
| 23 | Port of Prince Rupert | Prince Rupert, British Columbia | container, break bulk, dry bulk, liquid bulk, special project cargo, passenger | 1,054,836 | 1,141,390 | -7.6% | 25,071,050 |
| 24 | Port Everglades *** | Broward County, Fla. | container, break bulk, dry bulk, liquid bulk, passenger | 1,038,179 | 945,512 | 9.8% | 21,346,991 |
| 25 | Port of Baltimore ^ | Baltimore | container, break bulk, dry bulk, liquid bulk, automobile, refrigerated, passenger | 1,022,683 | 1,051,840 | -2.8% | 31,934,742 |
| NOTE: Data for the ports of Manzanillo (Mexico), Kingston, Lázaro Cárdenas, Freeport, San Juan, Moín Container Terminal and Veracruz are from the United Nations Economic Commission for Latin America and the Carribbean. Data for the ports of Balboa, PSA Panama International Terminal, Cristobal, Colon Container Terminal and Manzanillo International Terminal are from the Georgia Tech Panama Logistics Innovation and Research Center. All other data is from respective port authorities. * Tonnage data for the Port of Los Angeles is from its fiscal year ending June 30, 2021. ** Includes data regarding the Panamanian ports of Cristobal, Colon Container Terminal and Manzanillo International Terminal; not to be confused with the Port of Manzanillo in Colima, Mexico. *** TEU and tonnage data for the Port of Jacksonville, Port Miami and Port Everglades is from their fiscal year ending Sept. 30, 2021. ^ Tonnage data for the ports of New York and New Jersey, Savannah, Charleston, Oakland, San Juan and Baltimore are from calendar year 2020, sourced from the United States Army Corp of Engineers. All other tonnage data is from calendar year 2021. |
|||||||

Extras

Last year saw air- and sea-freight volumes bounce back from supply chain struggles.

If your company appears in the 2022 list, you have a few ways to announce it. Visit our logo library to get web- and print-ready graphics.

Learn more about Transport Topics’ Top 50 Global Freight Companies publication.
Global Freight News
Amazon Workers Seek $30 an Hour in North Carolina
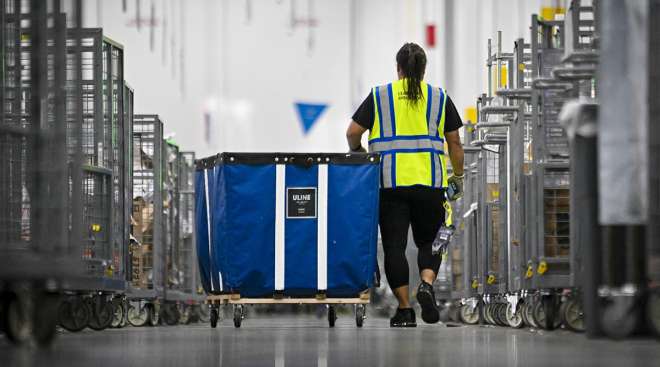
Amazon employee organizers in Garner, N.C., won the right to hold an election this week to determine whether workers at the facility will be represented by an upstart union.
February 11, 2025Rivian Broadens Sales of Van Once Exclusive to Amazon

Rivian said it will sell its electric delivery van designed for Amazon to other customers, a move to boost revenue from fleet operators as consumer demand for battery-powered cars slows.
February 10, 2025Trump Maintains Duty-Free Exception on Chinese Goods

President Donald Trump said he would maintain the duty-free exception for low-value packages coming from China until “adequate systems are in place to fully and expediently process and collect tariff revenue.”
February 7, 2025Amazon Posts Strong Q4 Earnings, but Stock Dips on Q1 Outlook

Amazon on Feb. 6 reported better-than-expected revenue and profit for the holiday shopping period, but its share price dipped in after-hours trading due to disappointing guidance for Q1.
February 7, 2025Logistics Agents Put 30% Levy on Shein, Temu Retailers

Chinese retailers that sell on Shein and Temu have been asked by logistics agents to start paying an additional 30% levy after President Donald Trump hiked tariffs on goods imported to the U.S.
February 6, 2025US Postal Service Resumes Accepting Packages From China
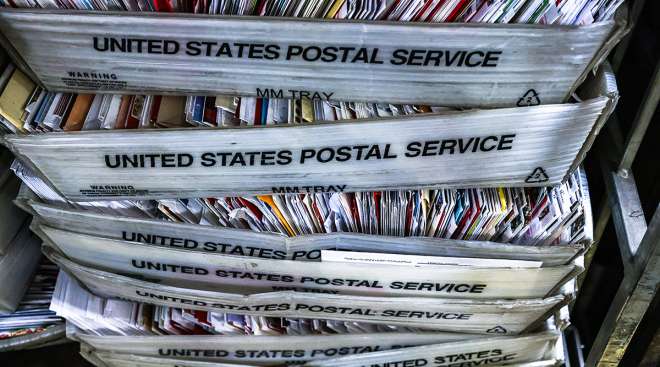
The U.S. Postal Service on Feb. 5 said it’s accepting “all international inbound mail and packages” from China and Hong Kong Posts, hours after the agency announced a halt on some shipments.
February 5, 2025Amazon to Face Legal Action After Layoffs in Quebec
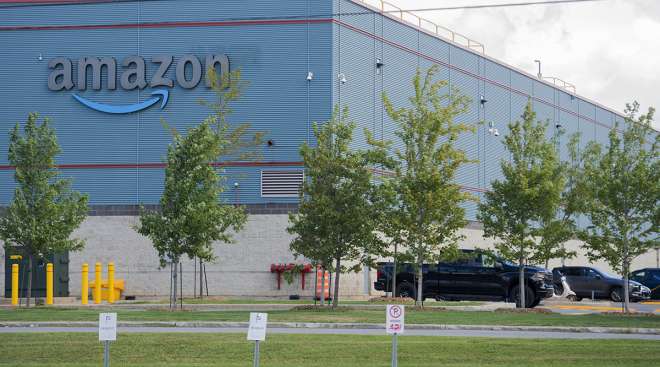
Amazon.com Inc.’s decision to close all seven of its warehouses in the Canadian province of Quebec and terminate more than 1,900 workers is prompting legal action from the affected union.
February 4, 2025UPS Posts 1.5% Revenue Growth; Shares Fall on Amazon Deal
UPS Inc. experienced revenue and earnings growth despite a tougher freight market in the fourth quarter of 2024, the parcel delivery company reported Jan. 30.
January 30, 2025US, UK Ships Return to Red Sea on Houthis’ Vow to Hold Fire
British and American ships are tentatively returning to the Red Sea after Yemen’s Houthi rebels vowed to hold off attacks on vessels linked to both nations.
January 28, 2025Whole Foods CEO Buechel Named Amazon’s Grocery Chief

Buechel, a former management consultant, joined Whole Foods in 2013, and led efforts to unify the formerly decentralized chain’s technology and record-keeping systems.
January 28, 2025Archives
-

2023
-
2022
-
2021
-
2020
-
2019
-
2018
-
2017
-
2016
-
2015