Rankings
Port Data
| Rank | Port Name | City | Type of Freight | TEUs 2022 | TEUs 2021 | % Change | Freight Tonnage (metric tons) |
|---|---|---|---|---|---|---|---|
| 1 | Port of Los Angeles | Los Angeles | container, break bulk, dry bulk, liquid bulk, automotive, heavy lift, special project cargo, refrigerated, passenger | 9,911,159 | 10,677,610 | -7.2% | 219,000,000* |
| 2 | Port of New York and New Jersey | New York | container, break bulk, dry bulk, liquid bulk, automotive, heavy lift, special project cargo, refrigerated, passenger | 9,493,664 | 8,985,929 | 5.7% | |
| 3 | Port of Long Beach | Long Beach, Calif. | container, break bulk, dry bulk, liquid bulk, automotive, heavy lift, special project cargo, refrigerated, passenger | 9,133,657 | 9,384,368 | -2.7% | 193,354,062 |
| 4 | Port of Savannah | Savannah, Ga. | container, break bulk, heavy lift, automobile, refrigerated | 5,892,131 | 5,613,163 | 5.0% | 38,459,904 |
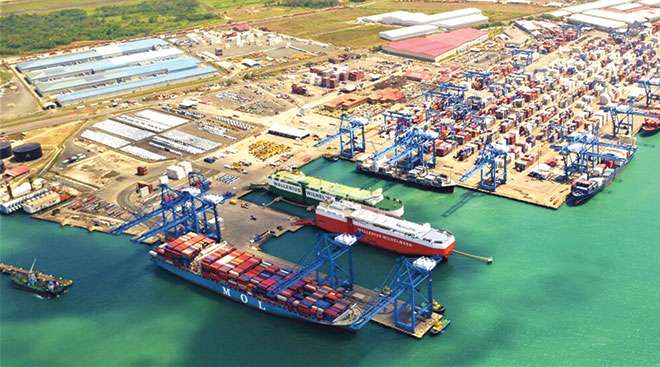
| 5 | Ports of Colon, Cristobal and Manzanillo | Colón, Panama | container, liquid bulk, dry bulk, passenger, transshipping | 5,058,556 | 4,915,975 | 2.9% | |
| 6 | Port Houston | Houston | container, break bulk, dry bulk, liquid bulk | 3,974,901 | 3,453,226 | 15.1% | 49,950,465 |
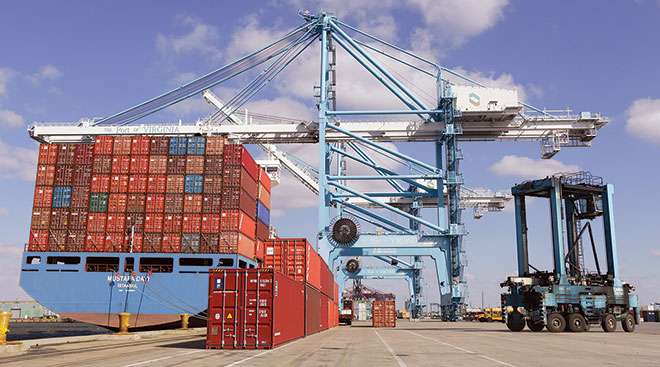
| 7 | Port of Virginia | Norfolk, Va. | container, break bulk, dry bulk, liquid bulk, automobile | 3,703,231 | 3,522,834 | 5.1% | 59,398,828 |
| 8 | Port of Vancouver | Vancouver, British Columbia | container, break bulk, dry bulk, liquid bulk, automobile, special project cargo, passenger | 3,557,294 | 3,678,952 | -3.3% | 142,469,186 |
| 9 | Port of Manzanillo | Manzanillo, Colima, Mexico | container, dry bulk, liquid bulk | 3,473,852 | 3,371,438 | 3.0% | 34,434,272 |
| 10 | Northwest Seaport Alliance | Seattle and Tacoma, Wash. | container, break bulk, liquid bulk, dry bulk, automobile, heavy lift, special project cargo, refrigerated, passenger, air cargo | 3,384,018 | 3,736,206 | -9.4% | 24,551,174 |
| 11 | Port of Balboa/PSA Panama International Terminal | Panama Int'l Terminals, Panama | container, transshipping | 3,347,861 | 3,561,432 | -6.0% | |
| 12 | Port of Charleston | Charleston, S.C. | container, break bulk, dry bulk, automobile, refrigerated | 2,792,313 | 2,751,442 | 1.5% | |
| 13 | Port of Oakland | Oakland, Calif. | container | 2,337,607 | 2,448,243 | -4.5% | |
| 14 | Port of Kingston | Kingston, Jamaica | container, heavy lift, liquid bulk | 2,137,500 | 1,975,401 | 8.2% | |
| 15 | Port of Montreal | Montreal | container, break bulk, dry bulk, liquid bulk, passenger | 1,722,704 | 1,728,114 | -0.3% | 35,997,337 |
| 16 | Port of Lázaro Cárdenas | Lázaro Cárdenas, Michoacán, Mexico | container, break bulk, dry bulk, liquid bulk, transshipping | 1,700,000 | 1,686,076 | 0.8% | |
| 17 | Port of Freeport | Freeport, Bahamas | container, passenger | 1,574,200 | 1,642,780 | -4.2% | |
| 18 | Port of Caucedo | Caucedo, Dominican Republic | container, refrigerated, transshipping | 1,406,500 | 1,250,000 | 12.5% | |
| 19 | Port of San Juan | San Juan, Puerto Rico | container | 1,398,600 | 1,438,738 | -2.8% | |
| 20 | Port of Jacksonville^ | Jacksonville, Fla. | container, break bulk, dry bulk, liquid bulk, automobile, heavy lift, refrigerated | 1,298,132 | 1,407,310 | -7.8% | 9,101,666 |
| 21 | Port Miami^ | Miami | container, passenger | 1,197,663 | 1,254,062 | -4.5% | 9,267,587 |
| 22 | Moín Container Terminal | Límon, Costa Rica | container | 1,182,854 | 1,319,372 | -10.3% | |
| 23 | Port Everglades | Broward County, Fla. | container, break bulk, dry bulk, liquid bulk, passenger | 1,107,546 | 1,038,179 | 6.7% | 24,129,601 |
| 24 | Port of Baltimore | Baltimore | container, break bulk, dry bulk, liquid bulk, automobile, refrigerated, passenger | 1,069,421 | 1,022,683 | 4.6% | 10,307,241 |
| 25 | Port of Prince Rupert | Prince Rupert, British Columbia | container, break bulk, dry bulk, liquid bulk, special project cargo, passenger | 1,035,639 | 1,054,836 | -1.8% | 24,593,720 |
| NOTE: Data for the ports of Kingston, Freeport, Caucedo and San Juan are via PortEconomics. Data for the Port of Lázaro Cárdenas is via the American Journal of Transportation. All other data is via port authorities. * Freight tonnage for the Port of Los Angeles is for fiscal year 2021-22, ended June 30, 2022. ^ Data for the Port of Jacksonville and Port Miami is for fiscal year 2021-22, ended Sept. 30, 2022. |
|||||||
Shipping Container Lines Set to Smash Year-Old Profit Record
The world’s biggest container lines are on course to post profits in 2022 that will top last year’s record by 73%, according to a new forecast, buoyed by logistics and labor strains that are squeezing capacity amid sustained U.S. demand for imports.
August 9, 2022HMM to Continue Deploying More Ships as Port Congestion Persists
HMM Co., the biggest container-shipping line in South Korea, will continue deploying more vessels than usual to try to meet demand from the country’s exporters struggling to transport goods overseas.
May 10, 2022Labor Leaders Optimistic Over Port Contract Talks
With negotiations expected to begin soon between the 22,000-member International Longshore and Warehouse Union and the Pacific Maritime Association, ILWU leaders are expressing confidence that the two sides will reach an agreement — without an interruption in work — before the June 30 deadline for the current contract expiration.
April 13, 2022

