Rankings
Port Data
| Rank | Port Name | City | Type of Freight | TEUs 2023 | TEUs 2022 | % Change | Freight Tonnage (metric tons) |
|---|---|---|---|---|---|---|---|
| 1 | Port of Los Angeles | Los Angeles | container, break bulk, dry bulk, liquid bulk, automotive, heavy lift, project, refrigerated | 8,629,681 | 9,911,159 | -12.9% | 178,000,000* |
| 2 | Port of Long Beach | Long Beach, Calif. | container, break bulk, dry bulk, liquid bulk, automotive, heavy lift, project, refrigerated | 8,018,668 | 9,133,657 | -12.2% | 175,518,642 |
| 3 | Port of New York and New Jersey | New York | container, break bulk, dry bulk, liquid bulk, automotive, heavy lift, project, refrigerated | 7,810,005 | 9,493,664 | -17.7% | NA |
| 4 | Port of Savannah | Savannah, Ga. | container, break bulk, dry bulk, automotive, heavy lift, refrigerated | 4,927,654 | 5,892,131 | -16.4% | 34,739,800 |
| 5 | Colon Container Terminal, Port of Cristobal and Manzanillo International Terminal | Colón, Panama | container, dry bulk, liquid bulk, project | 4,868,759 | 5,058,556 | -3.8% | NA |
| 6 | Port Houston | Houston | container, break bulk, dry bulk, liquid bulk, automotive, heavy lift, project | 3,824,600 | 3,974,901 | -3.8% | 45,652,497 |
| 7 | Port of Manzanillo | Manzanillo, Colima, Mexico | container, dry bulk, liquid bulk, automotive, refrigerated | 3,698,582 | 3,473,852 | 6.5% | 33,828,606 |
| 8 | Port of Balboa and PSA Panama International Terminal | Panama Int'l Terminals, Panama | container, dry bulk, liquid bulk, automotive, project | 3,370,009 | 3,347,861 | 0.7% | NA |
| 9 | Port of Virginia | Norfolk, Va. | container, break bulk, dry bulk, liquid bulk, automotive | 3,287,546 | 3,703,230 | -11.2% | 59,089,478 |
| 10 | Port of Vancouver | Vancouver, British Columbia | container, break bulk, dry bulk, liquid bulk, automotive, project | 3,126,559 | 3,557,294 | -12.1% | 150,380,603 |
| 11 | Northwest Seaport Alliance | Seattle and Tacoma, Wash. | container, break bulk, dry bulk, liquid bulk, automotive, heavy lift, project | 2,974,416 | 3,384,018 | -12.1% | 23,804,032 |
| 12 | Port of Charleston | Charleston, S.C. | container, break bulk, dry bulk, liquid bulk, automotive, project, refrigerated | 2,482,080 | 2,792,313 | -11.1% | NA |
| 13 | Port of Oakland | Oakland, Calif. | container, refrigerated | 2,065,709 | 2,337,607 | -11.6% | NA |
| 14 | Port of Kingston | Kingston, Jamaica | container, break bulk, dry bulk, liquid bulk, automotive, heavy lift | 1,995,000 | 2,137,500 | -6.7% | NA |
| 15 | Port of Lázaro Cárdenas | Lázaro Cárdenas, Michoacán, Mexico | container, dry bulk, liquid bulk | 1,869,293 | 2,026,546 | -7.8% | 29,585,287 |
| 16 | Port of Montreal | Montreal | container, break bulk, dry bulk, liquid bulk, refrigerated | 1,538,464 | 1,722,704 | -10.7% | 35,346,163 |
| 17 | Port of Caucedo | Caucedo, Dominican Republic | container, break bulk, automotive, heavy lift, project, refrigerated | 1,488,000 | 1,406,500 | 5.8% | NA |
| 18 | Port of San Juan | San Juan, Puerto Rico | container, break bulk, dry bulk | 1,349,400 | 1,398,600 | -3.5% | NA |
| 19 | Port of Jacksonville^ | Jacksonville, Fla. | container, break bulk, dry bulk, liquid bulk, automotive, heavy lift, project, refrigerated | 1,313,487 | 1,298,132 | 1.2% | 10,470,025 |
| 20 | Moín Container Terminal | Límon, Costa Rica | container, break bulk | 1,261,262 | 1,226,585 | 2.8% | NA |
| 21 | Port of Freeport | Freeport, Bahamas | container, break bulk, automotive, heavy lift, project | 1,215,000e | 1,574,200 | -22.8% | NA |
| 22 | Port of Veracruz | Veracruz, Mexico | container, break bulk, dry bulk, liquid bulk, automotive | 1,148,000 | 1,187,000 | -3.3% | NA |
| 23 | Port of Baltimore | Baltimore | container, break bulk, dry bulk, liquid bulk, automotive, refrigerated | 1,126,511 | 1,069,421 | 5.3% | 10,617,657 |
| 24 | Port Miami^ | Miami | container, break bulk, automotive | 1,098,322 | 1,197,663 | -8.3% | 9,717,000 |
| 25 | Port Everglades^ | Broward County, Fla. | container, break bulk, dry bulk, refrigerated | 1,006,981 | 1,107,546 | -9.1% | NA |
| NOTE: Data for the Colon Container Terminal, Port of Cristobal and Manzanillo International Terminal is from the Georgia Tech Panama Logistics Innovation and Research Center. Data for the ports of Kingston, Caucedo, San Juan, Freeport and Veracruz is via PortEconomics. Data for the ports of Lázaro Cárdenas and Manzanillo is via the Coordinación General de Puertos y Marina Mercante. All other data is via port authorities. * Freight tonnage for the Port of Los Angeles is for fiscal year 2022-23, ended June 30, 2023. ^ Data for the Port of Jacksonville, Port Miami and Port Everglades is for fiscal year 2022-23, ended Sept. 30, 2023. |
|||||||
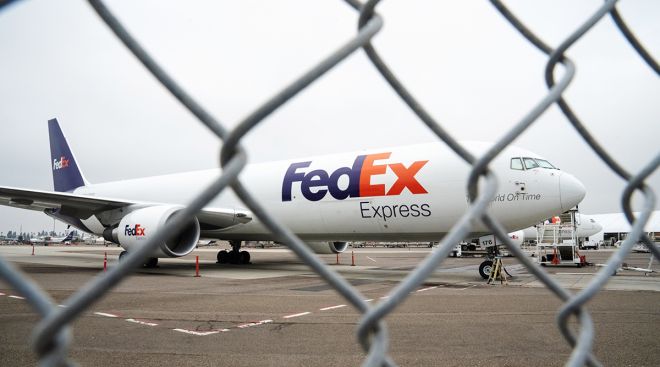
FedEx Pilots Plan Strike Authorization Vote as Labor Talks Stall
FedEx Corp. pilots are inching closer to a potential strike as negotiations stall on a new labor agreement.
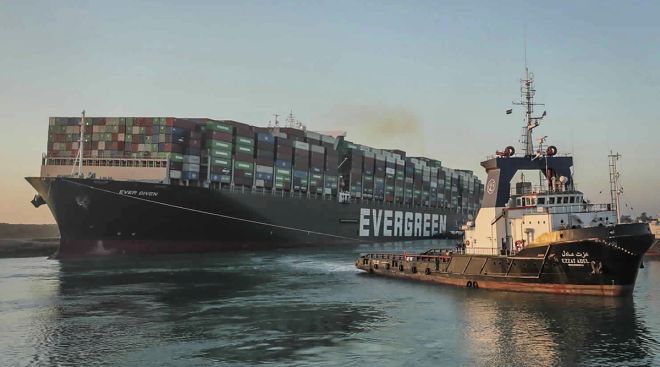
February 23, 2023Maersk Suing Evergreen Over 2021 Suez Canal Blockage
Shipping giant A.P. Moeller-Maersk said in an email to The Associated Press that it filed a claim against Evergreen Marine Corp., the vessel’s Japanese owner and its German technical manager in the Danish Maritime and Commercial High Court.
February 13, 2023Maersk Sees Global Trade Contracting as Much as 2.5% in 2023
A.P. Moller-Maersk A/S said “muted” economic growth is set to push the world’s container shipping volumes down by as much as 2.5% this year.
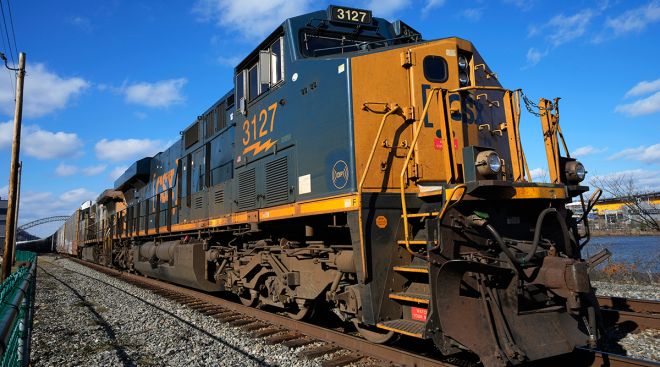
February 8, 2023Thousands of CSX Workers First to Get Paid Sick Leave
OMAHA, Neb. — Several thousand workers at CSX will soon get one of the things that pushed the U.S. railroad industry to the brink of a strike last fall: paid sick time.
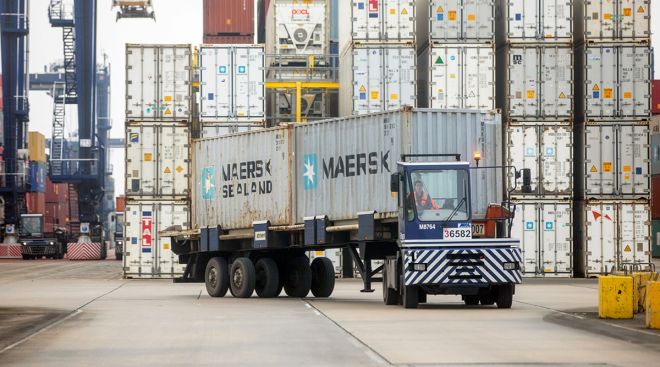
February 8, 2023Supply Chains Must Change, Says Maersk’s Ditlev Blicher
Increasing volatility in global supply chains means shipping lines must undergo a radical restructuring to survive, according to A.P. Moller-Maersk A/S.
February 8, 2023FedEx to Cut Management Jobs by More Than 10%
FedEx Corp. is cutting global officer and director jobs by more than 10%, the courier’s latest cost-saving measure as economic concerns and waning e-commerce weigh on demand for package delivery.
February 1, 2023Drop in Global Shipping Costs Signals Cooling Inflation, Experts Say
The pandemic-era surge in shipping costs was a “smoking gun” that foretold the global inflation spike, and the sharp drop in maritime-freight expenses since peaking last year will contribute to an easing in price pressures.
January 25, 2023Union Pacific Profit Disappoints After Costly Winter Storms
Union Pacific Corp. reported fourth-quarter profit that missed analysts’ estimates as disruptions from winter storms drove up costs.
January 24, 2023Port of Mobile Posts All-Time Container Shipping Figures in 2022
The Port of Mobile has set a new record for annual container traffic, beating the benchmark it set in 2021 by more than 11%.
January 20, 2023Multiple Factors Turn California Ports Into ‘Dormant Volcano’
A year ago in early January, a record 109 containerships carrying U.S. imports surrounded the twin ports of Los Angeles and Long Beach, Calif. — as of today, the queue is gone.
January 11, 2023

