Rankings
Port Data
| Rank | Port Name | City | Type of Freight | TEUs 2023 | TEUs 2022 | % Change | Freight Tonnage (metric tons) |
|---|---|---|---|---|---|---|---|
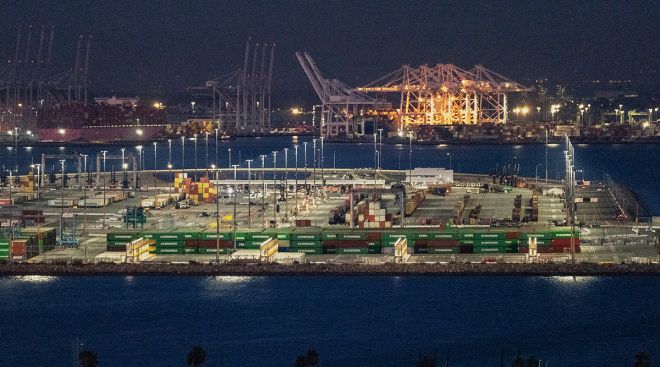
| 1 | Port of Los Angeles | Los Angeles | container, break bulk, dry bulk, liquid bulk, automotive, heavy lift, project, refrigerated | 8,629,681 | 9,911,159 | -12.9% | 178,000,000* |
| 2 | Port of Long Beach | Long Beach, Calif. | container, break bulk, dry bulk, liquid bulk, automotive, heavy lift, project, refrigerated | 8,018,668 | 9,133,657 | -12.2% | 175,518,642 |
| 3 | Port of New York and New Jersey | New York | container, break bulk, dry bulk, liquid bulk, automotive, heavy lift, project, refrigerated | 7,810,005 | 9,493,664 | -17.7% | NA |
| 4 | Port of Savannah | Savannah, Ga. | container, break bulk, dry bulk, automotive, heavy lift, refrigerated | 4,927,654 | 5,892,131 | -16.4% | 34,739,800 |
| 5 | Colon Container Terminal, Port of Cristobal and Manzanillo International Terminal | Colón, Panama | container, dry bulk, liquid bulk, project | 4,868,759 | 5,058,556 | -3.8% | NA |
| 6 | Port Houston | Houston | container, break bulk, dry bulk, liquid bulk, automotive, heavy lift, project | 3,824,600 | 3,974,901 | -3.8% | 45,652,497 |
| 7 | Port of Manzanillo | Manzanillo, Colima, Mexico | container, dry bulk, liquid bulk, automotive, refrigerated | 3,698,582 | 3,473,852 | 6.5% | 33,828,606 |
| 8 | Port of Balboa and PSA Panama International Terminal | Panama Int'l Terminals, Panama | container, dry bulk, liquid bulk, automotive, project | 3,370,009 | 3,347,861 | 0.7% | NA |
| 9 | Port of Virginia | Norfolk, Va. | container, break bulk, dry bulk, liquid bulk, automotive | 3,287,546 | 3,703,230 | -11.2% | 59,089,478 |
| 10 | Port of Vancouver | Vancouver, British Columbia | container, break bulk, dry bulk, liquid bulk, automotive, project | 3,126,559 | 3,557,294 | -12.1% | 150,380,603 |
| 11 | Northwest Seaport Alliance | Seattle and Tacoma, Wash. | container, break bulk, dry bulk, liquid bulk, automotive, heavy lift, project | 2,974,416 | 3,384,018 | -12.1% | 23,804,032 |
| 12 | Port of Charleston | Charleston, S.C. | container, break bulk, dry bulk, liquid bulk, automotive, project, refrigerated | 2,482,080 | 2,792,313 | -11.1% | NA |
| 13 | Port of Oakland | Oakland, Calif. | container, refrigerated | 2,065,709 | 2,337,607 | -11.6% | NA |
| 14 | Port of Kingston | Kingston, Jamaica | container, break bulk, dry bulk, liquid bulk, automotive, heavy lift | 1,995,000 | 2,137,500 | -6.7% | NA |
| 15 | Port of Lázaro Cárdenas | Lázaro Cárdenas, Michoacán, Mexico | container, dry bulk, liquid bulk | 1,869,293 | 2,026,546 | -7.8% | 29,585,287 |
| 16 | Port of Montreal | Montreal | container, break bulk, dry bulk, liquid bulk, refrigerated | 1,538,464 | 1,722,704 | -10.7% | 35,346,163 |
| 17 | Port of Caucedo | Caucedo, Dominican Republic | container, break bulk, automotive, heavy lift, project, refrigerated | 1,488,000 | 1,406,500 | 5.8% | NA |
| 18 | Port of San Juan | San Juan, Puerto Rico | container, break bulk, dry bulk | 1,349,400 | 1,398,600 | -3.5% | NA |
| 19 | Port of Jacksonville^ | Jacksonville, Fla. | container, break bulk, dry bulk, liquid bulk, automotive, heavy lift, project, refrigerated | 1,313,487 | 1,298,132 | 1.2% | 10,470,025 |
| 20 | Moín Container Terminal | Límon, Costa Rica | container, break bulk | 1,261,262 | 1,226,585 | 2.8% | NA |
| 21 | Port of Freeport | Freeport, Bahamas | container, break bulk, automotive, heavy lift, project | 1,215,000e | 1,574,200 | -22.8% | NA |
| 22 | Port of Veracruz | Veracruz, Mexico | container, break bulk, dry bulk, liquid bulk, automotive | 1,148,000 | 1,187,000 | -3.3% | NA |
| 23 | Port of Baltimore | Baltimore | container, break bulk, dry bulk, liquid bulk, automotive, refrigerated | 1,126,511 | 1,069,421 | 5.3% | 10,617,657 |
| 24 | Port Miami^ | Miami | container, break bulk, automotive | 1,098,322 | 1,197,663 | -8.3% | 9,717,000 |
| 25 | Port Everglades^ | Broward County, Fla. | container, break bulk, dry bulk, refrigerated | 1,006,981 | 1,107,546 | -9.1% | NA |
| NOTE: Data for the Colon Container Terminal, Port of Cristobal and Manzanillo International Terminal is from the Georgia Tech Panama Logistics Innovation and Research Center. Data for the ports of Kingston, Caucedo, San Juan, Freeport and Veracruz is via PortEconomics. Data for the ports of Lázaro Cárdenas and Manzanillo is via the Coordinación General de Puertos y Marina Mercante. All other data is via port authorities. * Freight tonnage for the Port of Los Angeles is for fiscal year 2022-23, ended June 30, 2023. ^ Data for the Port of Jacksonville, Port Miami and Port Everglades is for fiscal year 2022-23, ended Sept. 30, 2023. |
|||||||
Fresh Fragility in Global Trade Set to Be Revealed in 2023
Since 2020, a pandemic-fueled supply crunch, Russia’s war with Ukraine, and a deepening rift in the U.S.-China trade relationship have hammered home the idea that the world needs more resilient trade networks.
January 3, 2023Shipping Insurers Back Off of Russia-Ukraine Trade
A host of shipping insurers altered their policies for 2023 to exclude claims linked to Russia’s war in Ukraine, a further sign of the industry’s growing concerns about losses stemming from the conflict.
December 28, 2022FedEx Profit Tops Estimates as Higher Prices Offset Decline in Shipments
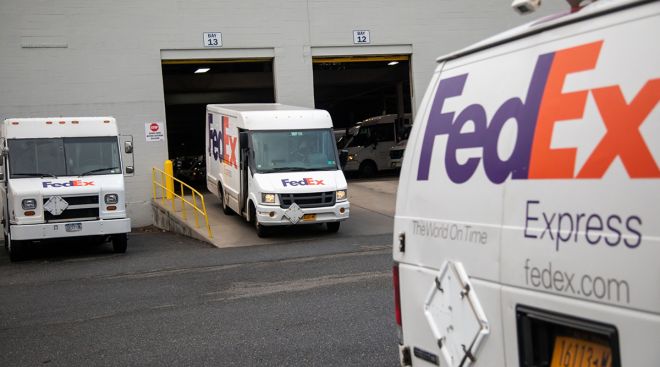
FedEx Corp. on Dec. 20 reported fiscal-year, second-quarter income that beat Wall Street expectations and revenue that fell below expectations.
December 21, 2022Union Pacific Puts Shipping Limits on Hold
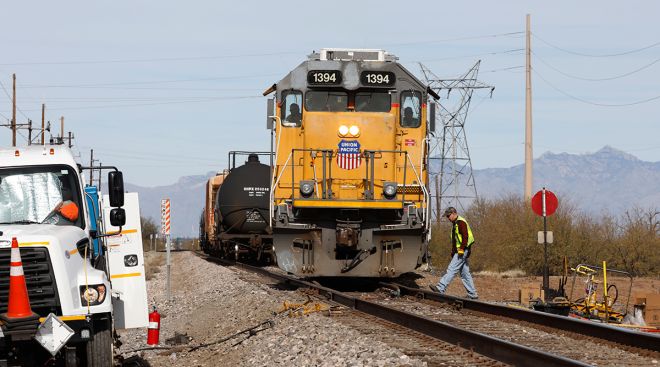
Union Pacific says it will stop imposing temporary limits on certain businesses’ shipments while it reviews the policy that federal regulators and shippers criticized at a hearing in mid-December.
December 19, 2022Union Pacific’s Embargoes Generate Complaints From Shippers
Federal regulators and shippers are questioning Union Pacific’s decision to temporarily limit some businesses’ shipments as part of its effort to clear up congestion across the railroad.
December 15, 2022Shippers Decry ‘Notoriously Difficult’ Railroads at Hearing
Shippers urged the U.S. railroad regulator to create more competition in the industry during hearings in which Union Pacific Corp. was called to explain a spike in service restrictions.
December 13, 2022Global Trade Surges to $32 Trillion Record in 2022, U.N. Says
The value of global trade is set to reach a new record this year, increasing by about 12% to an estimated $32 trillion, according to a U.N. report that signaled a slowdown heading into 2023.
December 13, 2022Maersk CEO Soren Skou Leaves, Will Be Replaced by Vincent Clerc
A.P. Moller-Maersk A/S CEO Soren Skou will step down and will be replaced by Vincent Clerc, the current head of the transport giant’s ocean and logistics business.
December 12, 2022Consumers Enjoy Tentative Relief as Supply Chains Unclog
The supply backlogs of the past two years — and the delays, shortages and outrageous prices that came with them — have improved dramatically since summer.
December 7, 2022Savannah Port Terminal to Get $410 Million Upgrade Amid Big Growth
The Port of Savannah plans a $410 million overhaul of one of its sprawling terminals to make room for loading and unloading larger ships while focusing its business almost exclusively on cargo shipped in containers.
December 5, 2022

