


Total container volume at the Port of Los Angeles rose 3.7% in April from a year ago, the 15th consecutive month of growth, the port said.
May 13, 2011Sponsored by:
2014 Essential Financial and Operating Information for the 50 largest logistics companies in the U.S. and Canada
Up Front
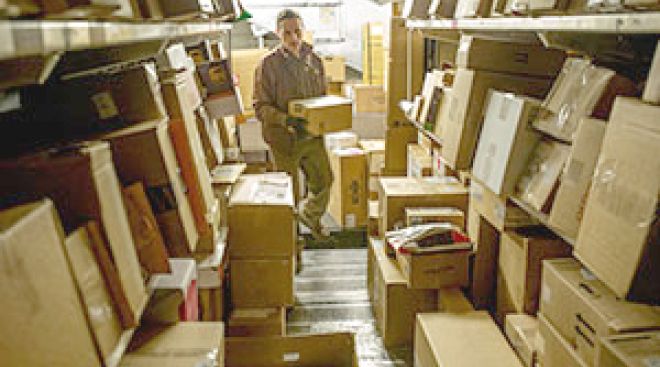
Our 2014 list produced a few surprises, some fast movers and some new names - along with a new No. 1.
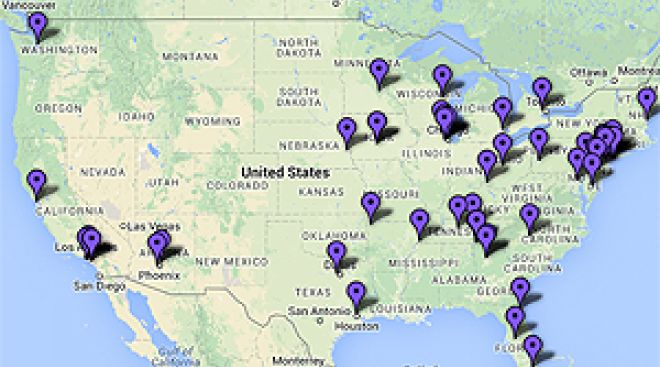
Get a high-level view of where our Top 50 Logistics Companies are located with our interactive Google map.
Our experts break down the rankings and analyze capacity and congestion concerns in a replay of our livestream video.
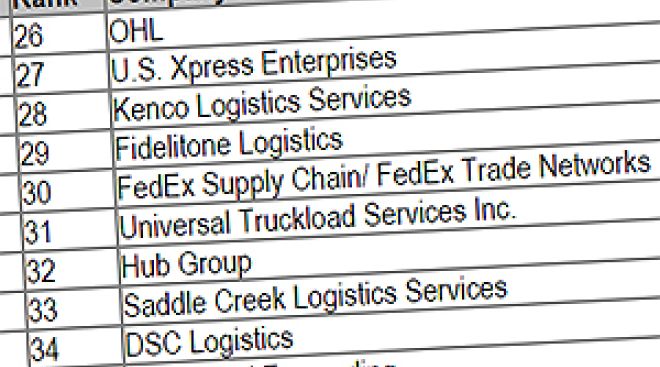
Rankings
| Rank This Year | Rank Last Year | Company | Net Revenue (Millions) | Gross Revenue (Millions) | Employees |
|---|---|---|---|---|---|
| 1 | 5 | UPS Supply Chain Solutions | $2,860 est
|
$5,492 | - |
| 2 | 2 | J.B. Hunt Transport Services | $2,600 est
|
$5,224 | - |
| 3 | 1 | DHL Supply Chain | $2,550 est
|
$4,600 | - |
| 4 | 3 | Ryder Supply Chain Solutions | $2,064 est
|
$2,383 | - |
| 5 | 16 | Expeditors International of Washington | $1,883 est
|
$6,080 | 13,900 |
| 6 | 6 | C.H. Robinson Worldwide | $1,836 est
|
$12,752 | 11,645 |
| 7 | 4 | Ceva Logistics (North America) | $1,770 est
|
$2,641 | - |
| 8 | 7 | Americold Logistics | $1,696 est
|
- | 12,000 |
| 9 | 26 | UTi Worldwide | $1,525 est
|
$4,441 | 21,018 |
| 10 | 10 | Schneider | $1,242 est
|
$3,390 | - |
| 11 | 11 | Kuehne + Nagel Americas | $1,109 est
|
$5,046 | - |
| 12 | 45 | XPO Logistics | $1,100 est
|
$2,800 | - |
| 13 | 12 | Genco | $1,007 est
|
$1,509 | 9,985 |
| 14 | 13 | APL Logistics (North America) | $955 est
|
$1,600 | - |
| 15 | 14 | NFI | $914 est
|
$1,091 | - |
| 16 | 18 | Swift Transportation | $890 est
|
$1,091 | - |
| 17 | 17 | Werner Enterprises | $832 est
|
$1,138 | 4,580 |
| 18 | 8 | DB Schenker (North America) | $806 est
|
$2,838 | 6,000 |
| 19 | 9 | Neovia Logistics | $800 est
|
- | - |
| 20 | 19 | Penske Logistics | $779 est
|
$968 | 10,089 |
| 21 | 22 | Ruan | $767 est
|
$807 | 5,139 |
| 22 | 20 | Menlo Worldwide | $682 est
|
$1,540 | 8,500 |
| 23 | 15 | Cardinal Logistics | $681 est
|
- | - |
| 24 | 24 | Jacobson Cos. | $590 est
|
$800 | 5,500 |
| 26 | 21 | OHL | $570 est
|
$1,142 | 8,158 |
| 27 | 27 | U.S. Xpress Enterprises | $475 est
|
$618 | - |
| 28 | 28 | Kenco Group | $474 est
|
$510 | 3,800 |
| 29 | 30 | Fidelitone | $471 est
|
$481 | 708 |
| 30 | 31 | FedEx Logistics | $458 est
|
$1,387 | 900 |
| 31 | 35 | Universal Logistics Holdings | $451 est
|
- | - |
| 32 | 29 | Hub Group | $371 est
|
$3,374 | 1,334 |
| 33 | 34 | Saddle Creek Logistics Services | $358 est
|
- | 2,470 |
| 34 | 32 | DSC Logistics | $340 est
|
- | - |
| 35 | 36 | Toll Global Forwarding | $297 est
|
$1,468 | - |
| 36 | 37 | Panalpina Inc. | $291 est
|
$1,225 | - |
| 37 | 42 | Total Quality Logistics | $288 est
|
$1,838 | 2,752 |
| 38 | 38 | Burris Logistics | $256 est
|
- | - |
| 39 | 39 | Performance Team | $255 est
|
- | 3,840 |
| 40 | 37 | BDP International | $254 est
|
$1,900 | - |
| 41 | Coyote Logistics | $231 est
|
$2,000 | 2,000 | |
| 42 | 43 | Preferred Freezer Services | $225 est
|
$275 | 1,800 |
| 43 | 47 | Cowan Logistics | $223 est
|
$330 | - |
| 44 | 33 | Landstar System | $217 est
|
$1,301 | - |
| 45 | 46 | SCI Group | $212 est
|
$213 | 1,800 |
| 46 | 44 | Averitt Express | $189 est
|
$326 | - |
| 47 | 49 | Damco International | $185 est
|
$1,007 | - |
| 48 | 40 | Agility Logistics | $175 est
|
$795 | - |
| 49 | Legacy Supply Chain Services | $170 est
|
$380 | - | |
| 50 | Echo Global Logistics | $155 est
|
$884 | 1,350 |
About the Rankings...
Top 50 Logistics Companies provide logistics services, including freight brokerage, freight forwarding, warehousing and dedicated contract carriage in North America and are ranked on the basis of annual gross revenue. Some sector rankings may have been updated since their print publication. To be included in the Top 50 list, please send contact information to tteditor@ttnews.com. We will contact you via phone or e-mail to get information about your company prior to publication of the next Top 50 list.

Extras
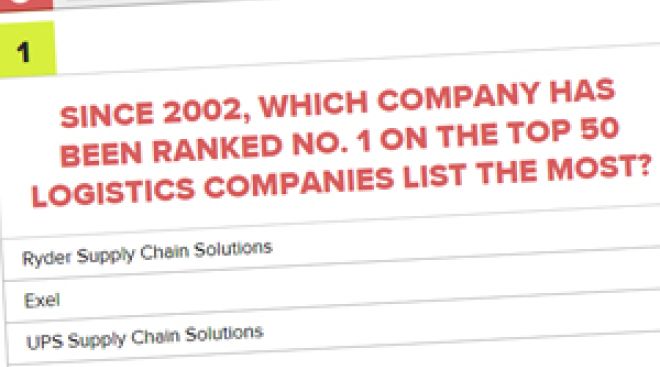
Test your familiarity with our Top 50 Logistics Companies with this interactive quiz. Share it on social media!
53
On the Bubble
Dupre Logistics
($149 million), Lafayette, Louisiana, provides dedicated contract carriage services.
If all you’re looking for are the 2014 Top 50 Logistics Companies and their rank, here they are in a simple, clean table form.
Logistics News
Business, Government, Logistics

Port of L.A. Container Volume Rises 3.7% in April
Business, Logistics

Weekly Intermodal Traffic Rises 11.2%
Intermodal traffic rose 11.2% last week from a year ago, the Association of American Railroads said.
May 13, 2011Business, Logistics
Horizon Lines Reports $33.3 Million 1Q Loss
Horizon Lines Inc., the ocean carrier that provides service between the U.S. mainland and Alaska as well as other locations, said it lost $33.3 million in the fiscal first quarter ended March 27, a loss that was nearly three times greater than the comparable 2010 period.
May 9, 2011Business, Logistics
Trailer Production in March More Than Doubles From 2010
Both orders and factory production of new commercial trailers more than doubled in March, compared with the same month of 2010 and leading to escalating prices and longer wait times, industry officials have said.
May 9, 2011Business, Logistics
Wabash Swings to First-Quarter Profit
Trailer manufacturer Wabash National Corp. reported a first-quarter profit on improved sales, turning around a loss from a year ago.
May 4, 2011Business, Logistics
North American Trailer Expands in Calif. With Acquisition
North American Trailer said it has acquired Fontana, Calif.-based Quality Fleet Repair, effective Sunday. Terms were not disclosed.
May 3, 2011Business, Logistics
Universal Truckload’s 1Q Profit Improves
Universal Truckload Services’ first-quarter income rose from a year ago as load volumes improved.
April 29, 2011Business, Government, Logistics
Consumer Confidence Increases in April
Consumer confidence rose in April from a 16-month low, according to the Thomson Reuters/University of Michigan consumer sentiment index released Friday.
April 29, 2011Logistics
Norfolk Southern’s 1Q Profit Improves
Norfolk Southern Corp.’s first-quarter profit rose from the same quarter last year on higher freight levels, the Eastern freight railroad said late Wednesday.
April 28, 2011Business, Logistics
Forward Air’s 1Q Income More than Doubles
Forward Air Corp.’s first-quarter net income rose to $7.9 million, or 27 cents a share, from $3.4 million, or 12 cents, a year ago.
April 21, 2011Archives
-

2023
-
2022
-
2021
-
2020
-
2019
-
2018
-
2017
-
2016
-
2015
-
2014
-
2013
-
2012
-
2011
-
2010
-
2009
-
2008
-
2007
-
2006
-
2005


