

Top 100 Private | Food Service | Grocery | Beverage | Petroleum/Chemical | Industrial Gases | Agriculture/Food Processing | Wholesale/Retail | Manufacturing
Equipment Rental | Building Materials | Waste Management | Paper/Office Products | Construction | Health Care | Uniform Rental | Media & Entertainment
| Rank This Year | Rank Last Year | Company | Tractors | Trucks | Pickups/ Cargo Vans | Trailers | Annual Revenue |
|---|---|---|---|---|---|---|---|
| 1 | 1 | PepsiCo Inc. |
11,100 | 3,500 | 20,600 | 17,500 | $63.5 billion |
| 2 | 2 | Sysco Corp. |
8,577 | 1,202 | - | 10,696 | $55.4 billion |
| 3 | 3 | Walmart Inc. |
6,472 | 145 | - | 61,640 | $500.3 billion |
| 4 | 6 | Reyes Holdings |
5,443 | 804 | 1,250 | 6,659 | $26.5 billion |
| 5 | 7 | Halliburton Co. |
5,382 | 2,885 | 254 | 10,362 | $20.6 billion |
| 6 | 5 | U.S. Foods |
5,336 | 389 | - | 6,650 | $24.0 billion |
| 7 | 8 | Nutrien |
4,349 | 2,261 | 8,622 | 8,554 | $13.7 billion |
| 8 | 9 | McLane Co. |
3,941 | 135 | 31 | 5,750 | - |
| 9 | 11 | Schlumberger Limited |
3,652 | 517 | 249 | 5,107 | $30.4 billion |
| 10 | 12 | Performance Food Group |
2,835 | 214 | - | 3,810 | $16.8 billion |
| 11 | 13 | Tyson Foods |
2,819 | 40 | 1,390 | 7,329 | $38.3 billion |
| 12 | 14 | Keurig Dr Pepper |
2,331 | 86 | 538 | 2,749 | $6.4 billion |
| 13 | 10 | C & J Energy Services |
2,306 | 454 | - | 3,715 | $1.6 billion |
| 14 | 20 | Basic Energy Services |
1,686 | 386 | - | 1,819 | $0.9 billion |
| 15 | 24 | United Rentals Inc. |
1,673 | 3,069 | - | 1,291 | $6.6 billion |
| 16 | 18 | CHS Inc. |
1,595 | 2,002 | - | 11,247 | $31.9 billion |
| 17 | 19 | Gordon Food Service |
1,519 | 17 | - | 2,041 | - |
| 18 | 17 | American Air Liquide Holdings |
1,472 | 4,184 | - | 2,331 | $23.7 billion |
| 19 | 23 | Albertsons Cos. |
1,450 | 1,030 | 75 | 5,300 | $59.9 billion |
| 20 | 44 | Coca-Cola Bottling Co. United |
1,427 | 513 | - | 1,915 | - |
| 21 | 25 | Clean Harbors Inc. |
1,375 | 5,187 | 21 | 4,361 | $2.9 billion |
| 22 | 26 | Dot Foods |
1,353 | 5 | 18 | 2,190 | - |
| 23 | 31 | The Quikrete Cos. |
1,248 | 47 | - | 1,899 | - |
| 24 | 27 | Gibson Energy Inc. |
1,200 | - | - | 2,500 | $6.1 billion |
| 25 | 30 | Sunbelt Rentals |
1,191 | 2,681 | - | 1,524 | $4.2 billion |
| 26 | - | FTS International |
1,116 | 178 | - | 1,485 | $1.5 billion |
| 27 | 41 | Core-Mark Holding Co. |
1,108 | 134 | - | 1,469 | $15.7 billion |
| 28 | 28 | Calfrac Well Services |
1,102 | 364 | - | 1,751 | $1.5 billion |
| 28 | 21 | Femsa Logistica |
1,102 | 1,100 | - | 2,130 | - |
| 30 | 37 | Ben E. Keith Co. |
1,066 | 82 | - | 1,333 | - |
| 31 | 57 | Ahold USA/Delhaize America |
1,062 | 714 | - | 4,560 | $44.5 billion |
| 32 | 33 | Pilot Flying J Inc. |
1,061 | 35 | - | 1,405 | - |
| 33 | 35 | Cemex USA |
1,030 | 3,354 | - | 1,689 | $3.5 billion |
| 34 | 32 | Praxair Inc. |
1,021 | 1,518 | - | 3,188 | $11.4 billion |
| 35 | 36 | Helena Chemical Co. |
1,004 | 2,507 | - | 2,575 | - |
| 36 | 43 | United Natural Foods |
943 | 6 | - | 1,084 | $9.3 billion |
| 37 | 39 | Builders FirstSource Inc. |
940 | 2,312 | - | 1,639 | $7.0 billion |
| 38 | 45 | Walgreen Co. |
920 | 24 | - | 2,387 | $118.2 billion |
| 39 | 69 | Maxim Crane Works |
903 | 99 | - | 1,428 | - |
| 40 | 22 | The Kroger Co. |
879 | 35 | - | 11,211 | $122.7 billion |
| 41 | 48 | Ashley Furniture Industries |
870 | 7 | - | 3,710 | - |
| 42 | 97 | BlueLinx Holdings |
836 | 47 | - | 881 | $1.8 billion |
| 42 | 38 | Veritiv Corp. |
836 | 97 | 149 | 1,415 | $8.4 billion |
| 44 | 34 | Darling Ingredients Inc. |
835 | 930 | 355 | 4,077 | $3.7 billion |
| 45 | 40 | Key Energy Services |
790 | 805 | - | 6,034 | $0.4 billion |
| 46 | 73 | Mondelez International |
779 | 106 | - | 996 | $26.0 billion |
| 47 | 16 | Dean Foods Co. |
765 | 761 | - | 2,262 | $7.8 billion |
| 48 | 47 | Prairie Farms Dairy |
761 | 1,218 | - | 2,431 | $3.0 billion |
| 49 | 54 | ABC Supply Co. |
750 | 2,400 | 262 | 1,000 | - |
| 50 | 53 | Love's Travel Stops & Country Stores |
740 | - | - | 780 | - |
| 50 | 49 | Univar Inc. |
740 | 125 | - | 1,775 | $8.3 billion |
| 52 | 42 | Plains All American Pipeline |
730 | - | - | 900 | $26.0 billion |
| 53 | 61 | Shaw Industries Group |
725 | 60 | - | 3,210 | - |
| 54 | 46 | Food Services of America |
714 | 50 | - | 820 | - |
| 55 | 52 | Southern Glazer's Wine and Spirits |
702 | 2,203 | - | 1,118 | - |
| 56 | 59 | Supervalu Inc. |
694 | 5 | - | 2,637 | $14.2 billion |
| 57 | 75 | SE Independent Delivery Services |
691 | 103 | - | 1,202 | - |
| 58 | 80 | Bunzl Distribution USA |
686 | - | 37 | 1,168 | $6.5 billion |
| 59 | 83 | Beacon Roofing Supply |
682 | 1,436 | - | 1,168 | $4.4 billion |
| 60 | 68 | Golden State Foods |
681 | 33 | - | 877 | $7.0 billion |
| 61 | 55 | Advanced Drainage Systems |
675 | - | - | 1,200 | $1.3 billion |
| 62 | - | Coca-Cola Bottling Co. of Northern New England |
672 | 100 | - | 890 | - |
| 63 | 56 | Swire Coca-Cola USA |
669 | 242 | - | 801 | $1.8 billion |
| 64 | 60 | Sherwin-Williams Co. |
667 | 1 | - | 1,670 | $15.0 billion |
| 65 | 50 | Anheuser-Busch Cos. |
666 | 133 | - | 773 | - |
| 66 | 65 | JBS USA Holdings |
665 | - | - | 1,430 | $26.8 billion |
| 67 | 62 | Publix Super Markets |
659 | 18 | 414 | 3,265 | $34.6 billion |
| 68 | 58 | Shamrock Foods |
655 | 75 | 75 | 1,098 | - |
| 69 | 98 | Select Energy Services |
653 | 630 | - | 1,763 | $0.7 billion |
| 70 | 63 | Cudd Energy Services |
638 | 239 | - | 881 | - |
| 71 | - | ProPetro Holding Corp. |
630 | 43 | - | 773 | $1.0 billion |
| 72 | - | Liberty Coca-Cola Beverages |
620 | 231 | - | 768 | - |
| 73 | 66 | Energy Transfer Partners |
605 | 95 | - | 712 | $29.0 billion |
| 74 | 71 | Archer Daniels Midland (ADM) Co. |
602 | 87 | - | 1,702 | $60.8 billion |
| 75 | - | Coca-Cola Beverages Florida |
598 | 14 | - | 657 | - |
| 76 | 78 | Air Products Inc. |
589 | 94 | 330 | 2,000 | $8.2 billion |
| 77 | 64 | Brenntag North America |
587 | 80 | - | 1,487 | - |
| 78 | 74 | Nestle USA |
581 | 3,353 | - | 1,435 | $26.7 billion |
| 79 | - | Williams Brothers Construction |
575 | 200 | - | 253 | - |
| 80 | 15 | Baker Hughes |
571 | 63 | - | 355 | $22.0 billion |
| 81 | 77 | C&S Wholesale Grocers |
567 | - | - | 1,613 | - |
| 82 | 79 | MDU Resources Group Inc. |
563 | 1,797 | - | 1,844 | $4.4 billion |
| 83 | 80 | Stericycle Inc. |
556 | 3,762 | - | 2,095 | $3.6 billion |
| 84 | 82 | Foster Farms |
536 | 96 | 10 | 1,621 | - |
| 85 | 84 | Gravity Oilfield Services |
529 | 69 | - | 541 | - |
| 86 | 76 | H.E.B. Grocery Co. |
517 | 5 | - | 2,355 | - |
| 87 | 85 | Linde North America |
508 | 1,877 | - | 1,421 | - |
| 88 | 87 | Mohawk Industries |
488 | 159 | - | 2,217 | $9.5 billion |
| 89 | 90 | Ace Hardware Corp. |
469 | 1 | 1 | 1,440 | $5.4 billion |
| 90 | 88 | Valley Proteins Inc. |
466 | 151 | 54 | 1,198 | - |
| 91 | - | Medline Inc. |
462 | 121 | - | 547 | $10.0 billion |
| 92 | 72 | Oldcastle Inc. |
460 | 894 | 2 | 1,266 | - |
| 93 | 100 | Herc Rentals |
444 | 300 | - | 447 | $1.8 billion |
| 94 | 91 | Pepsi Bottling Ventures |
441 | 141 | 176 | 609 | - |
| 94 | 93 | The H.T. Hackney Co. |
441 | 172 | - | 578 | - |
| 96 | 89 | KeHE Distributors |
438 | 1 | 1 | 742 | - |
| 97 | 92 | Sanderson Farms Inc. |
436 | 31 | - | 706 | $3.3 billion |
| 98 | 94 | Bragg Cos. |
433 | - | - | 682 | - |
| 98 | 67 | Nuverra Environmental Solutions |
433 | 180 | - | 553 | $0.2 billion |
| 100 | 95 | Dunkin' Brands Group |
430 | 12 | - | 450 | $0.9 billion |
The Top 100 Private Carriers on this list operate their own trucks to carry freight and are ranked on the basis of the total number of highway tractors in the fleet. To be included in the Top 100 list, please send contact information to tteditor@ttnews.com. We will contact you via phone or e-mail to get information about your company prior to publication of the next Top 100 list.

On the Bubble
Walmart Challenges Amazon With Prescription Delivery
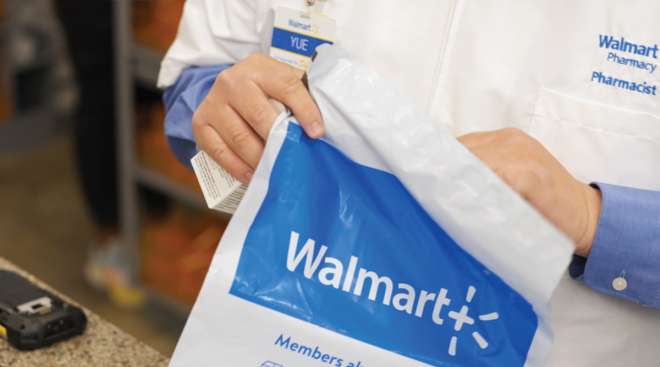
Walmart Inc. will start delivering prescriptions to U.S. homes in as little as 30 minutes, a move that’s intended to grab a bigger slice of online spending and compete against Amazon.com Inc.
Consumers Switch to Slower Shipping, Squeezing UPS, FedEx
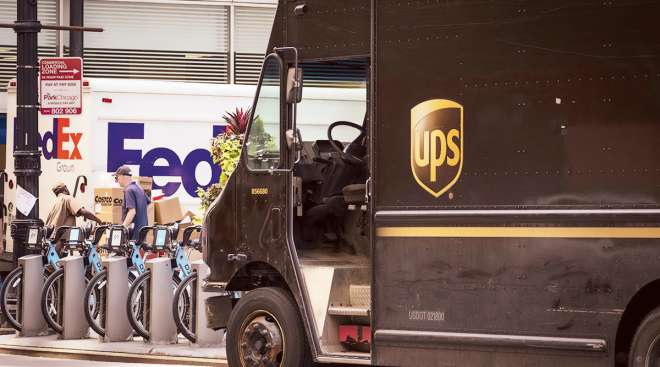
More people are switching to slower delivery options to save money, and profits at FedEx Corp. and UPS Inc. are getting squeezed.
Amazon, Google Make Dueling Nuclear Investments
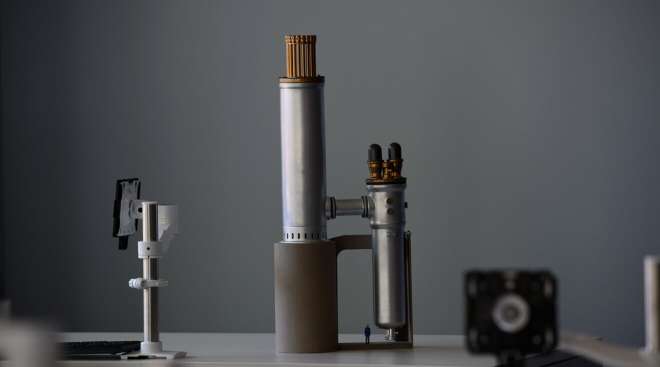
Amazon on Oct. 16 said it was investing in small nuclear reactors, coming just two days after a similar announcement by Google, as both tech giants seek new sources of carbon-free electricity.
Walgreens to Close 1,200 US Stores
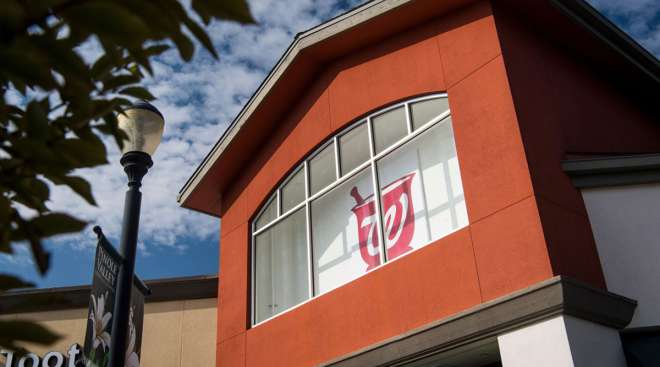
Walgreens will close about 1,200 locations over the next three years as the drugstore chain seeks to turn around a struggling U.S. business that contributed to a $3 billion quarterly loss.
Amazon Unveils AI Tool to Help Drivers Find Packages Faster

Amazon.com Inc. unveiled a new artificial intelligence tool designed to help drivers locate packages in cluttered vans.
Charging Developer Terawatt Opens First Facility for Fleets
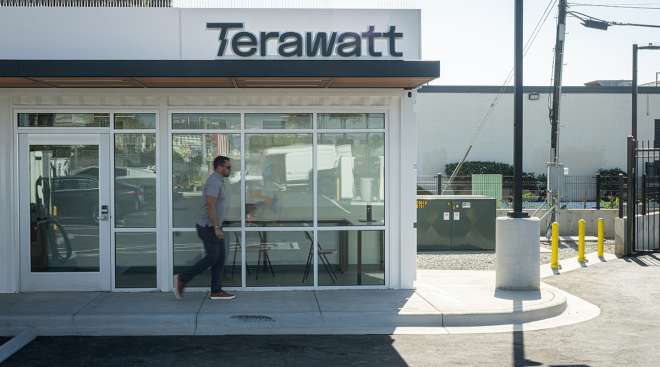
Terawatt Infrastructure’s truck charging ambitions took a step forward with the opening of its first full-build light-duty fleet facility.
PepsiCo Lowers Revenue Forecast as Sales Growth Weakens
PepsiCo lowered its organic revenue forecast for the year after U.S. consumers continued to pull back on buying its snacks and drinks.
Amazon, Target and Other Retailers Ramp Up Holiday Hiring
Retailers are ramping up hiring for the holiday season, but fewer seasonal employees are expected to be taken on this year to help customers in stores and assemble online orders in warehouses.
Online Holiday Spending Projected to Rise 8.4%

Steep discounts and easing inflation will compel U.S. shoppers to spend $240.8 billion online in November and December, up 8.4% from last year’s holidays and the biggest increase since 2021.
PepsiCo Expands EV Fleet to Boost Cost Savings

HANOVER, Germany — Electrification within the PepsiCo fleet is creating cost savings, and the company has plans to scale electric trucks across North America.
-

2023
-
2022
-
2021
-
2020
-
2019
-
2018
-
2017
-
2016
-
2015
-
2014
-
2013
-
2012
-
2011
-
2010
-
2009
-
2008
-
2007
-
2006
-
2005
-
2004