Top 100 Private | Food Service | Grocery | Beverage | Petroleum/Chemical | Industrial Gases | Agriculture/Food Processing | Wholesale/Retail | Manufacturing
Equipment Rental | Building Materials | Waste Management | Paper/Office Products | Construction | Health Care | Uniform Rental | Media & Entertainment
| Rank This Year | Rank Last Year | Company | Tractors | Trucks | Pickups/ Cargo Vans | Trailers | Annual Revenue |
|---|---|---|---|---|---|---|---|
| 1 | 1 | PepsiCo Inc. |
11,100 | 3,500 | 20,600 | 17,500 | $63.5 billion |
| 2 | 2 | Sysco Corp. |
8,577 | 1,202 | - | 10,696 | $55.4 billion |
| 3 | 3 | Walmart Inc. |
6,472 | 145 | - | 61,640 | $500.3 billion |
| 4 | 6 | Reyes Holdings |
5,443 | 804 | 1,250 | 6,659 | $26.5 billion |
| 5 | 7 | Halliburton Co. |
5,382 | 2,885 | 254 | 10,362 | $20.6 billion |
| 6 | 5 | U.S. Foods |
5,336 | 389 | - | 6,650 | $24.0 billion |
| 7 | 8 | Nutrien |
4,349 | 2,261 | 8,622 | 8,554 | $13.7 billion |
| 8 | 9 | McLane Co. |
3,941 | 135 | 31 | 5,750 | - |
| 9 | 11 | Schlumberger Limited |
3,652 | 517 | 249 | 5,107 | $30.4 billion |
| 10 | 12 | Performance Food Group |
2,835 | 214 | - | 3,810 | $16.8 billion |
| 11 | 13 | Tyson Foods |
2,819 | 40 | 1,390 | 7,329 | $38.3 billion |
| 12 | 14 | Keurig Dr Pepper |
2,331 | 86 | 538 | 2,749 | $6.4 billion |
| 13 | 10 | C & J Energy Services |
2,306 | 454 | - | 3,715 | $1.6 billion |
| 14 | 20 | Basic Energy Services |
1,686 | 386 | - | 1,819 | $0.9 billion |
| 15 | 24 | United Rentals Inc. |
1,673 | 3,069 | - | 1,291 | $6.6 billion |
| 16 | 18 | CHS Inc. |
1,595 | 2,002 | - | 11,247 | $31.9 billion |
| 17 | 19 | Gordon Food Service |
1,519 | 17 | - | 2,041 | - |
| 18 | 17 | American Air Liquide Holdings |
1,472 | 4,184 | - | 2,331 | $23.7 billion |
| 19 | 23 | Albertsons Cos. |
1,450 | 1,030 | 75 | 5,300 | $59.9 billion |
| 20 | 44 | Coca-Cola Bottling Co. United |
1,427 | 513 | - | 1,915 | - |
| 21 | 25 | Clean Harbors Inc. |
1,375 | 5,187 | 21 | 4,361 | $2.9 billion |
| 22 | 26 | Dot Foods |
1,353 | 5 | 18 | 2,190 | - |
| 23 | 31 | The Quikrete Cos. |
1,248 | 47 | - | 1,899 | - |
| 24 | 27 | Gibson Energy Inc. |
1,200 | - | - | 2,500 | $6.1 billion |
| 25 | 30 | Sunbelt Rentals |
1,191 | 2,681 | - | 1,524 | $4.2 billion |
| 26 | - | FTS International |
1,116 | 178 | - | 1,485 | $1.5 billion |
| 27 | 41 | Core-Mark Holding Co. |
1,108 | 134 | - | 1,469 | $15.7 billion |
| 28 | 28 | Calfrac Well Services |
1,102 | 364 | - | 1,751 | $1.5 billion |
| 28 | 21 | Femsa Logistica |
1,102 | 1,100 | - | 2,130 | - |
| 30 | 37 | Ben E. Keith Co. |
1,066 | 82 | - | 1,333 | - |
| 31 | 57 | Ahold USA/Delhaize America |
1,062 | 714 | - | 4,560 | $44.5 billion |
| 32 | 33 | Pilot Flying J Inc. |
1,061 | 35 | - | 1,405 | - |
| 33 | 35 | Cemex USA |
1,030 | 3,354 | - | 1,689 | $3.5 billion |
| 34 | 32 | Praxair Inc. |
1,021 | 1,518 | - | 3,188 | $11.4 billion |
| 35 | 36 | Helena Chemical Co. |
1,004 | 2,507 | - | 2,575 | - |
| 36 | 43 | United Natural Foods |
943 | 6 | - | 1,084 | $9.3 billion |
| 37 | 39 | Builders FirstSource Inc. |
940 | 2,312 | - | 1,639 | $7.0 billion |
| 38 | 45 | Walgreen Co. |
920 | 24 | - | 2,387 | $118.2 billion |
| 39 | 69 | Maxim Crane Works |
903 | 99 | - | 1,428 | - |
| 40 | 22 | The Kroger Co. |
879 | 35 | - | 11,211 | $122.7 billion |
| 41 | 48 | Ashley Furniture Industries |
870 | 7 | - | 3,710 | - |
| 42 | 97 | BlueLinx Holdings |
836 | 47 | - | 881 | $1.8 billion |
| 42 | 38 | Veritiv Corp. |
836 | 97 | 149 | 1,415 | $8.4 billion |
| 44 | 34 | Darling Ingredients Inc. |
835 | 930 | 355 | 4,077 | $3.7 billion |
| 45 | 40 | Key Energy Services |
790 | 805 | - | 6,034 | $0.4 billion |
| 46 | 73 | Mondelez International |
779 | 106 | - | 996 | $26.0 billion |
| 47 | 16 | Dean Foods Co. |
765 | 761 | - | 2,262 | $7.8 billion |
| 48 | 47 | Prairie Farms Dairy |
761 | 1,218 | - | 2,431 | $3.0 billion |
| 49 | 54 | ABC Supply Co. |
750 | 2,400 | 262 | 1,000 | - |
| 50 | 53 | Love's Travel Stops & Country Stores |
740 | - | - | 780 | - |
| 50 | 49 | Univar Inc. |
740 | 125 | - | 1,775 | $8.3 billion |
| 52 | 42 | Plains All American Pipeline |
730 | - | - | 900 | $26.0 billion |
| 53 | 61 | Shaw Industries Group |
725 | 60 | - | 3,210 | - |
| 54 | 46 | Food Services of America |
714 | 50 | - | 820 | - |
| 55 | 52 | Southern Glazer's Wine and Spirits |
702 | 2,203 | - | 1,118 | - |
| 56 | 59 | Supervalu Inc. |
694 | 5 | - | 2,637 | $14.2 billion |
| 57 | 75 | SE Independent Delivery Services |
691 | 103 | - | 1,202 | - |
| 58 | 80 | Bunzl Distribution USA |
686 | - | 37 | 1,168 | $6.5 billion |
| 59 | 83 | Beacon Roofing Supply |
682 | 1,436 | - | 1,168 | $4.4 billion |
| 60 | 68 | Golden State Foods |
681 | 33 | - | 877 | $7.0 billion |
| 61 | 55 | Advanced Drainage Systems |
675 | - | - | 1,200 | $1.3 billion |
| 62 | - | Coca-Cola Bottling Co. of Northern New England |
672 | 100 | - | 890 | - |
| 63 | 56 | Swire Coca-Cola USA |
669 | 242 | - | 801 | $1.8 billion |
| 64 | 60 | Sherwin-Williams Co. |
667 | 1 | - | 1,670 | $15.0 billion |
| 65 | 50 | Anheuser-Busch Cos. |
666 | 133 | - | 773 | - |
| 66 | 65 | JBS USA Holdings |
665 | - | - | 1,430 | $26.8 billion |
| 67 | 62 | Publix Super Markets |
659 | 18 | 414 | 3,265 | $34.6 billion |
| 68 | 58 | Shamrock Foods |
655 | 75 | 75 | 1,098 | - |
| 69 | 98 | Select Energy Services |
653 | 630 | - | 1,763 | $0.7 billion |
| 70 | 63 | Cudd Energy Services |
638 | 239 | - | 881 | - |
| 71 | - | ProPetro Holding Corp. |
630 | 43 | - | 773 | $1.0 billion |
| 72 | - | Liberty Coca-Cola Beverages |
620 | 231 | - | 768 | - |
| 73 | 66 | Energy Transfer Partners |
605 | 95 | - | 712 | $29.0 billion |
| 74 | 71 | Archer Daniels Midland (ADM) Co. |
602 | 87 | - | 1,702 | $60.8 billion |
| 75 | - | Coca-Cola Beverages Florida |
598 | 14 | - | 657 | - |
| 76 | 78 | Air Products Inc. |
589 | 94 | 330 | 2,000 | $8.2 billion |
| 77 | 64 | Brenntag North America |
587 | 80 | - | 1,487 | - |
| 78 | 74 | Nestle USA |
581 | 3,353 | - | 1,435 | $26.7 billion |
| 79 | - | Williams Brothers Construction |
575 | 200 | - | 253 | - |
| 80 | 15 | Baker Hughes |
571 | 63 | - | 355 | $22.0 billion |
| 81 | 77 | C&S Wholesale Grocers |
567 | - | - | 1,613 | - |
| 82 | 79 | MDU Resources Group Inc. |
563 | 1,797 | - | 1,844 | $4.4 billion |
| 83 | 80 | Stericycle Inc. |
556 | 3,762 | - | 2,095 | $3.6 billion |
| 84 | 82 | Foster Farms |
536 | 96 | 10 | 1,621 | - |
| 85 | 84 | Gravity Oilfield Services |
529 | 69 | - | 541 | - |
| 86 | 76 | H.E.B. Grocery Co. |
517 | 5 | - | 2,355 | - |
| 87 | 85 | Linde North America |
508 | 1,877 | - | 1,421 | - |
| 88 | 87 | Mohawk Industries |
488 | 159 | - | 2,217 | $9.5 billion |
| 89 | 90 | Ace Hardware Corp. |
469 | 1 | 1 | 1,440 | $5.4 billion |
| 90 | 88 | Valley Proteins Inc. |
466 | 151 | 54 | 1,198 | - |
| 91 | - | Medline Inc. |
462 | 121 | - | 547 | $10.0 billion |
| 92 | 72 | Oldcastle Inc. |
460 | 894 | 2 | 1,266 | - |
| 93 | 100 | Herc Rentals |
444 | 300 | - | 447 | $1.8 billion |
| 94 | 91 | Pepsi Bottling Ventures |
441 | 141 | 176 | 609 | - |
| 94 | 93 | The H.T. Hackney Co. |
441 | 172 | - | 578 | - |
| 96 | 89 | KeHE Distributors |
438 | 1 | 1 | 742 | - |
| 97 | 92 | Sanderson Farms Inc. |
436 | 31 | - | 706 | $3.3 billion |
| 98 | 94 | Bragg Cos. |
433 | - | - | 682 | - |
| 98 | 67 | Nuverra Environmental Solutions |
433 | 180 | - | 553 | $0.2 billion |
| 100 | 95 | Dunkin' Brands Group |
430 | 12 | - | 450 | $0.9 billion |
The Top 100 Private Carriers on this list operate their own trucks to carry freight and are ranked on the basis of the total number of highway tractors in the fleet. To be included in the Top 100 list, please send contact information to tteditor@ttnews.com. We will contact you via phone or e-mail to get information about your company prior to publication of the next Top 100 list.
On the Bubble
Tyson, JBS Set for Earnings Spike From Poultry Rebound
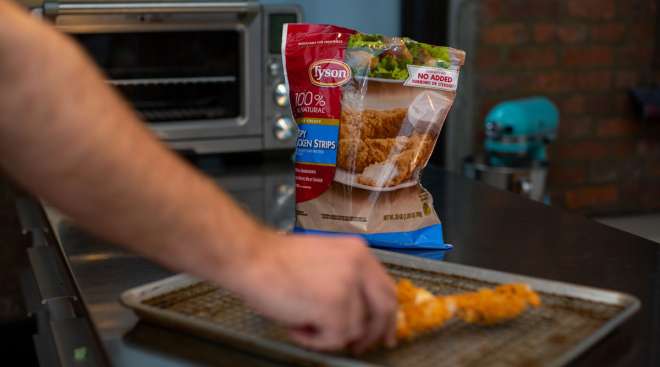
Companies including Tyson Foods Inc. and JBS SA, which control a sizable chunk of global meat supplies, are set to report a spike in earnings for the quarter ended in June as a rebound in poultry profits counterbalances a downturn in their US beef operations.
FAA Clears Drone Companies to Operate in Shared Airspace
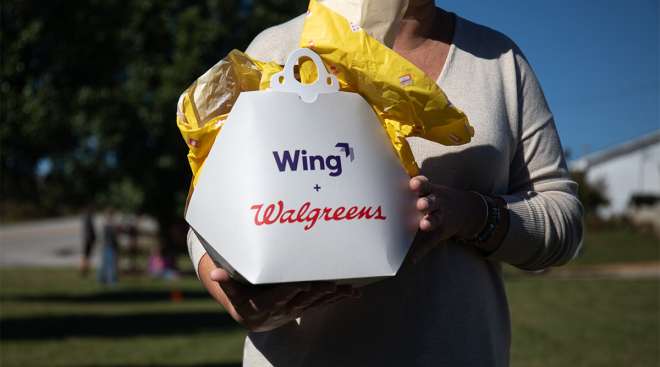
The FAA has cleared Wing and Zipline to fly their drones simultaneously over the suburbs of Dallas-Fort Worth without visual observers, using technology to keep the drones apart.
Amazon Deemed Responsible for Hazardous Third-Party Items
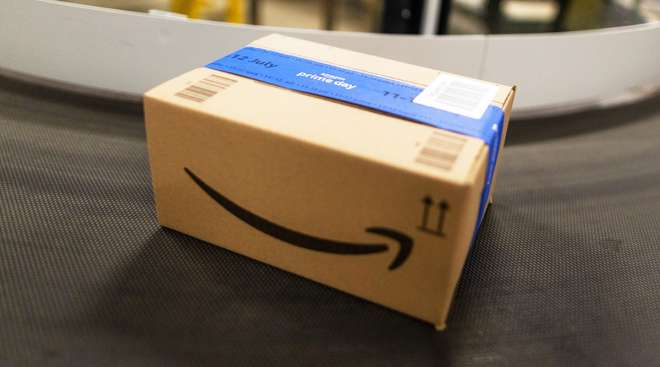
Amazon is responsible under federal safety law for hazardous products sold on its platform by third-party sellers and shipped by the company, a U.S. government agency ordered July 30.
ADM’s Profit Shrinks on Crop Market Downturn
Archer-Daniels-Midland Co.’s quarterly profit shrank more than expected as the grain trading giant faces a downturn in crop markets.
Amazon Prime Day Drives Online Sales Up 11% to $14.2 Billion
U.S. shoppers spent $14.2 billion online during Amazon.com Inc.’s 48-hour Prime Day sale, up 11% from a year ago and in line with estimates, according to Adobe Inc.
Amazon Prime Day Sales Rise 13% in First Six Hours of Event
Amazon’s Prime Day sales rose about 13% in the first six hours of the event compared with the same period last year, according to Momentum Commerce.
Stop & Shop Closing 32 Grocery Stores in US Northeast
Stop & Shop said July 12 that it will close 32 underperforming grocery stores in the Northeast U.S. by the end of the year.
PepsiCo’s Q2 Profits Jump, but Demand Continues to Slip
PepsiCo reported higher-than-expected earnings in the second quarter but customer demand for its snacks and drinks continued to slip.
Costco Hikes Annual Membership Fee for First Time Since 2017
Costco Wholesale Corp. is boosting its basic membership fee for the first time since 2017, raising the charge to $65 a year from $60.
ADM Taps 3M CFO as Troubled Trader Seeks Return to Normalcy
Archer-Daniels-Midland Co. — working to put an accounting scandal behind it — has hired a 3M Co. executive to oversee its finances and help restore its credibility with shareholders.


