2017 Essential Financial and Operating Information for the 100 largest For-Hire Carriers in North America
Share
Up Front


Rankings
| Rank This Year | Rank Last Year | Company | Revenue (000) | Net Income (000) | Employees | Tractors* | Trailers |
|---|---|---|---|---|---|---|---|
| 1 | 1 | UPS Inc.
|
60,906,000 | 3,431,000 | 434,000 | ||
| 2 | 2 | FedEx Corp.
|
57,570,000 | 1,907,000 | 400,000 | 29,733 | 108,041 |
| 3 | 3 | XPO
|
14,619,400 | 63,100 | 89,000 | 15,396 | 27,606 |
| 4 | 4 | J.B. Hunt Transport Services
|
6,555,459 | 432,090 | 22,172 | 14,805 | 30,330 |
| 5 | 5 | Yellow Corp.
|
4,697,500 | 21,500 | 32,000 | 14,300 | 44,500 |
| 6 | 7 | Schneider
|
4,045,736 | 156,851 | 19,300 | 10,459 | 37,910 |
| 7 | 6 | Swift Transportation
|
4,031,517 | 149,267 | 21,900 | 18,366 | 64,066 |
| 8 | 8 | Hub Group
|
3,572,790 | 74,805 | 2,755 | 2,705 | 436 |
| 9 | 9 | Landstar System
|
3,167,634 | 137,350 | 1,197 | 9,186 | 15,170 |
| 10 | 10 | TFI International
|
3,037,205 | 482,592 | 17,685 | 18,535 | 25,310 |
| 11 | 11 | Old Dominion Freight Line
|
2,991,517 | 295,765 | 19,040 | 7,994 | 32,525 |
| 12 | 12 | ArcBest
|
2,700,219 | 18,652 | 13,000 | 4,387 | 21,361 |
| 13 | 13 | Ryder System
|
2,658,745 | 169,172 | 67,900 | 42,800 | |
| 14 | 14 | Estes Express Lines
|
2,400,000 | - | 16,570 | 7,009 | 26,718 |
| 15 | 16 | Roadrunner Freight
|
2,044,000 | - | 4,645 | 4,332 | 6,508 |
| 16 | 15 | Werner Enterprises
|
2,008,991 | 79,129 | 11,738 | 7,100 | 24,350 |
| 17 | 17 | UniGroup
|
1,700,000 | - | |||
| 18 | 18 | Prime Inc.
|
1,683,834 | 194,247 | 3,661 | 6,246 | 12,309 |
| 19 | 24 | CRST The Transportation Solution
|
1,546,000 | - | 7,849 | 6,682 | 13,811 |
| 20 | 26 | Purolator
|
1,526,207 | - | 10,000 | 463 | 1,280 |
| 21 | 23 | Penske Logistics
|
1,500,000 | - | 14,180 | 2,704 | 8,785 |
| 21 | 20 | Sirva
|
1,400,000 | - | |||
| 21 | 19 | U.S. Xpress Enterprises
|
1,500,000 | - | 10,135 | 7,000 | 15,500 |
| 24 | R+L Carriers
|
1,452,000 | - | 10,000 | 5,958 | 12,604 | |
| 25 | 21 | Kenan Advantage Group
|
1,421,975 | - | 7,561 | 6,869 | 10,404 |
| 26 | 23 | C.R. England
|
1,304,898 | - | 7,883 | 4,165 | 5,990 |
| 27 | 27 | NFI
|
1,250,000 | - | 8,300 | 2,793 | 8,300 |
| 28 | 25 | Saia Inc.
|
1,218,481 | 48,024 | 9,000 | 4,000 | 13,000 |
| 29 | 28 | Southeastern Freight Lines
|
1,192,296 | - | 8,458 | 3,734 | 11,943 |
| 30 | 29 | Knight-Swift Transportation Holdings
|
1,118,034 | 93,863 | 5,500 | 4,705 | 9,915 |
| 31 | 32 | Averitt Express
|
1,091,475 | - | 4,500 | 14,623 | |
| 32 | 30 | Universal Logistics Holdings
|
1,072,751 | 24,244 | 6,275 | 3,801 | 4,154 |
| 33 | 32 | Celadon Group Inc.
|
1,050,000 | 2,700 | 6,000 | 7,050 | 15,000 |
| 34 | 37 | Anderson Trucking Service
|
1,032,144 | - | 1,410 | 2,372 | 6,300 |
| 35 | 33 | Crete Carrier Corp.
|
1,030,000 | - | 5,500 | 5,130 | 12,883 |
| 36 | Cardinal Logistics
|
1,000,600 | - | 4,642 | 3,020 | 9,725 | |
| 37 | 35 | Forward Air
|
982,530 | 27,670 | 3,689 | 935 | 4,868 |
| 38 | 36 | KLLM Transport Services
|
937,000 | - | 3,815 | 5,300 | |
| 39 | 34 | Lynden
|
925,000 | - | 2,800 | 768 | 2,889 |
| 40 | 38 | Ruan
|
872,184 | - | 5,546 | 3,425 | 8,165 |
| 41 | 39 | Atlas World Group
|
795,239 | - | 2,159 | ||
| 42 | 46 | Daseke Inc. (TFI)
|
770,000 | -8,700 | 3,400 | 3,500 | 7,300 |
| 43 | 42 | Quality Carriers
|
758,000 | - | |||
| 44 | 113 | Central Transport International
|
703,000 | - | 3,180 | 6,543 | |
| 45 | 42 | Trimac Transportation
|
700,000 | - | 3,400 | 1,800 | 2,400 |
| 46 | 47 | Marten Transport
|
671,144 | 33,464 | 3,622 | 2,848 | 4,854 |
| 47 | 43 | Covenant Logistics Group
|
670,651 | 16,835 | 4,400 | 2,535 | 7,389 |
| 48 | 44 | Jack Cooper Holdings
|
667,849 | - | 2,119 | 2,126 | |
| 49 | 46 | Stevens Transport
|
662,450 | 77,990 | 2,703 | 2,690 | 3,795 |
| 50 | 52 | Pitt Ohio
|
649,972 | - | 3,178 | 866 | 2,072 |
| 51 | 45 | Day & Ross
|
640,515 | - | 1,829 | 1,531 | 4,010 |
| 52 | 41 | Heartland Express
|
612,937 | 56,386 | 3,600 | 5,049 | 15,218 |
| 53 | 54 | AAA Cooper Transportation
|
605,538 | - | 4,600 | 2,400 | 6,000 |
| 54 | 49 | Suddath
|
550,000 | - | |||
| 55 | 52 | Western Express
|
527,909 | 38,334 | 3,000 | 2,582 | 7,366 |
| 56 | 54 | United Road Services
|
525,000 | - | 1,700 | 1,835 | 1,200 |
| 56 | OnTrac Inc.
|
525,000 | - | 3,000 | 55 | 571 | |
| 58 | 51 | Mullen Group
|
520,272 | - | 3,267 | 1,821 | 4,998 |
| 59 | 59 | Evans Delivery
|
505,000 | - | 320 | 3,865 | 650 |
| 60 | 58 | Dayton Freight Lines
|
498,370 | - | 4,010 | 1,387 | 3,664 |
| 61 | 58 | PS Logistics
|
495,300 | - | 2,600 | 2,247 | 2,359 |
| 62 | 57 | Canada Cartage
|
452,728 | - | 3,110 | 2,429 | 2,736 |
| 63 | 55 | Mercer Transportation
|
449,337 | - | 295 | 2,228 | 2,400 |
| 64 | 69 | Dart Transit Co.
|
441,845 | - | 1,273 | 2,187 | 6,963 |
| 65 | 63 | California Cartage Co.
|
440,000 | - | 1,500 | ||
| 66 | 60 | Shevell Group
|
436,000 | - | 3,895 | 1,550 | 3,902 |
| 67 | 62 | Cowan Systems
|
434,018 | - | 1,915 | 2,059 | 5,111 |
| 68 | 66 | P.A.M. Transport
|
432,852 | 11,101 | 2,463 | 5,699 | |
| 69 | 68 | Bennett Family of Cos.
|
429,616 | - | 998 | 1,338 | 1,892 |
| 70 | 53 | USA Truck
|
429,099 | -7,699 | 2,000 | 1,415 | 5,605 |
| 71 | 61 | TransX Group of Companies
|
423,678 | - | 2,617 | 1,560 | 4,410 |
| 72 | 66 | Mesilla Valley Transportation
|
402,940 | - | 1,900 | 1,400 | 5,100 |
| 73 | TMC Transportation
|
394,000 | - | ||||
| 74 | 65 | Bison Transport
|
432,084 | - | 2,559 | 1,439 | 4,475 |
| 75 | 70 | Interstate Distributor Co.
|
370,168 | - | 2,000 | 1,805 | 3,900 |
| 76 | 70 | Roehl Transport
|
355,323 | - | 2,485 | 1,995 | 4,898 |
| 77 | 96 | Central Freight Lines
|
347,800 | - | 1,127 | 7,852 | |
| 78 | 79 | A. Duie Pyle
|
346,000 | - | 2,800 | 945 | 2,225 |
| 79 | 78 | Black Horse Carriers
|
337,500 | - | 2,625 | 1,520 | 3,000 |
| 80 | 74 | Maverick USA
|
334,953 | - | 2,119 | 1,675 | 2,453 |
| 81 | 71 | Epes Carriers Inc.
|
332,073 | 24,333 | 1,535 | 1,202 | |
| 82 | 75 | Dicom Transportation Group
|
320,700 | - | |||
| 83 | 74 | Cassens Transport
|
317,557 | - | 1,419 | 1,364 | 1,364 |
| 84 | 80 | IMC Logistics
|
293,000 | - | 1,875 | 1,515 | 91 |
| 85 | 76 | Koch Cos.
|
280,000 | - | 1,150 | 1,001 | 5,250 |
| 86 | Dependable Supply Chain Services
|
278,000 | - | 321 | 1,220 | ||
| 87 | 91 | Transport Investments
|
276,000 | - | 200 | 1,150 | 2,100 |
| 88 | TransAm Trucking
|
270,000 | - | 1,144 | 1,818 | ||
| 89 | 82 | Challenger Motor Freight
|
258,006 | - | |||
| 90 | 83 | Trans-System
|
252,500 | - | 1,100 | 1,021 | 1,600 |
| 91 | 84 | Foodliner/Quest Liner
|
252,275 | - | 1,261 | 1,173 | 2,185 |
| 92 | Hirschbach Motor Lines
|
251,697 | - | 646 | 1,010 | ||
| 93 | United Vision Logistics
|
245,000 | - | 1,003 | 1,347 | ||
| 94 | Salmon Cos.
|
241,796 | - | 713 | 1,092 | ||
| 95 | 79 | Comcar Industries
|
240,054 | - | 1,592 | 4,660 | |
| 96 | 86 | John Christner Trucking
|
239,015 | 14,998 | 232 | 844 | 1,060 |
| 97 | 89 | Martin Transportation Systems
|
237,500 | - | 1,637 | 1,130 | 2,200 |
| 98 | 81 | Paschall Truck Lines
|
237,311 | - | 1,872 | 1,303 | 3,101 |
| 99 | 87 | Superior Bulk Logistics
|
233,900 | 5,200 | 1,392 | 1,300 | 2,100 |
| 100 | 94 | Quantix Supply Chain Solutions
|
229,258 | - | 1,100 | 900 | 1,200 |
Top For-Hire Carriers on this list are common and contract freight carriers operating in the United States, Canada and Mexico. Companies are ranked on the basis of annual revenue. To be included in the Top 100 or any of the sectors, please send contact information to tteditor@ttnews.com. We will contact you via phone or e-mail to get information about your company prior to publication of the next Top 100 list.
* Tractor count includes company-owned, lease-to-own and owner-operator tractors.
Extras

On the Bubble
For-Hire News
Ryder Reports Growth From Strong Operations During Q4
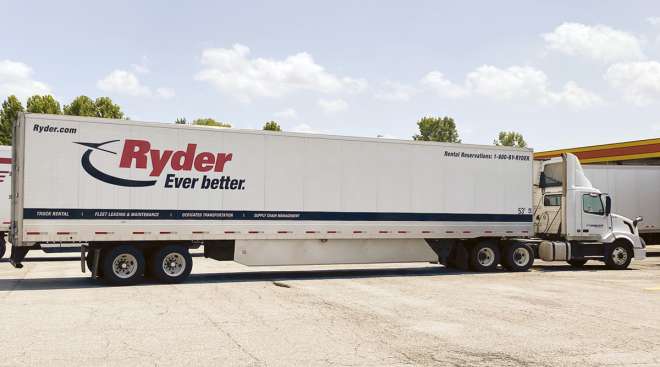
“We are pleased to report that this quarter is the first quarter in the last eight with year-over-year comparable earnings growth," CEO Robert Sanchez said during a call with investors.
Heartland Express Targets Major Operating Ratio Improvement
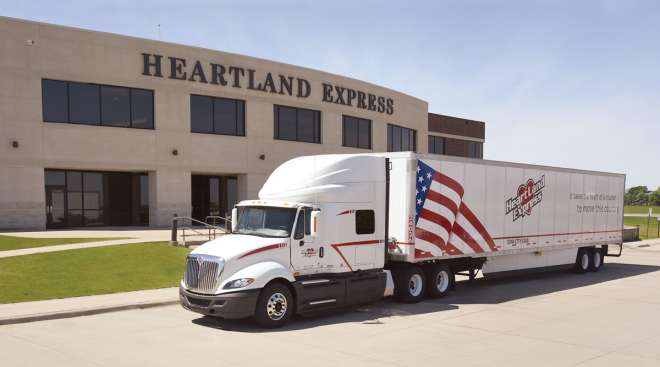
The Iowa-based company posted a loss in the fourth quarter of 2024 as the ongoing integration of two acquisitions alongside the industrywide freight recession weighed heavily on its OR.
Werner Posts Q4 Declines in Profit, Revenue
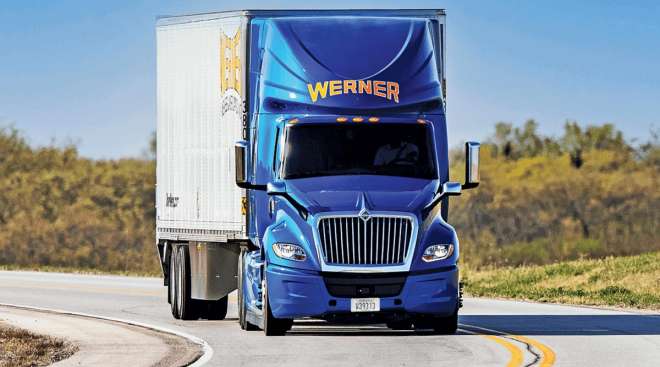
Werner Enterprises reported year-over-year income and revenue declines during the fourth quarter of 2024.
Hub Group Q4 Profit Falls Despite Intermodal Volume Growth
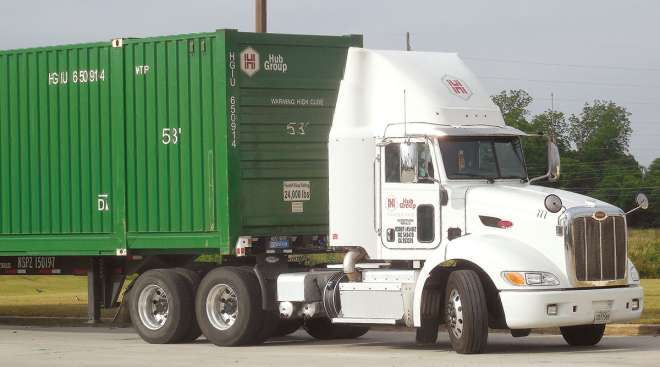
Fourth-quarter and full-year profit and revenue at Hub Group fell as lower revenue per load outweighed increased intermodal volume amid an ongoing weak freight market, the company said.
Universal Logistics Reports 19% Gain in Q4 Revenue
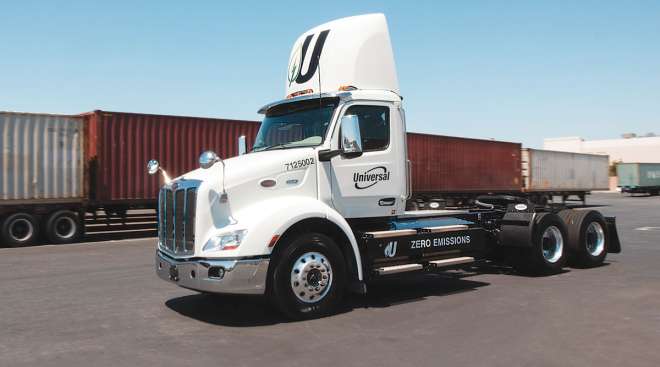
Universal Logistics Holdings experienced a 19% year-over-year increase in revenue but a slight dip in net income for the fourth quarter of 2024, the company reported Feb. 6.
Transportation M&A Gains Momentum in Late 2024

The transportation sector saw merger and acquisition activity gain momentum as market conditions stabilized in the second half of 2024, according to experts.
Purolator Buys Livingston to Boost International Operations
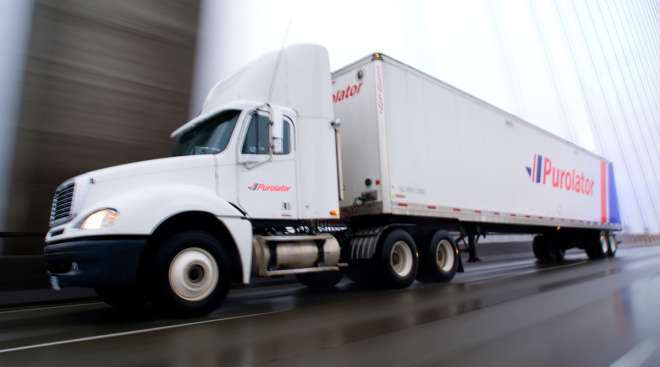
Purolator, which specializes in package delivery and is majority owned by Canada Post, sees the deal as an international growth play, particularly as the threat of trade wars grows.
Beacon Roofing Rejects Hostile QXO Bid
Beacon Roofing Supply has officially rejected a hostile takeover approach from QXO, setting the stage for a potentially protracted battle for control of the building supplies provider.
XPO Earnings Jump 31% Despite Revenue Dip in Q4 2024
The Greenwich, Conn.-based less-than-truckload carrier posted net income of $76 million, compared with $58 million during the same time the previous year.
LTL Players Eye Freight Market Turnaround, Industrial Upturn

Substantial change is expected in the U.S. less-than-truckload sector in 2025, according to market observers and executives, headed by the long-awaited freight market turnaround.
Archives
-

2023
-
2022
-
2021
-
2020
-
2019
-
2018
-
2017
-
2016
-
2015
-
2014
-
2013
-
2012
-
2011
-
2010
-
2009
-
2008
-
2007
-
2006
-
2005
-
2004