Rankings
Port Data
| Rank | Port Name | City | Type of Freight | TEUs 2022 | TEUs 2021 | % Change | Freight Tonnage (metric tons) |
|---|---|---|---|---|---|---|---|
| 1 | Port of Los Angeles | Los Angeles | container, break bulk, dry bulk, liquid bulk, automotive, heavy lift, special project cargo, refrigerated, passenger | 9,911,159 | 10,677,610 | -7.2% | 219,000,000* |
| 2 | Port of New York and New Jersey | New York | container, break bulk, dry bulk, liquid bulk, automotive, heavy lift, special project cargo, refrigerated, passenger | 9,493,664 | 8,985,929 | 5.7% | |
| 3 | Port of Long Beach | Long Beach, Calif. | container, break bulk, dry bulk, liquid bulk, automotive, heavy lift, special project cargo, refrigerated, passenger | 9,133,657 | 9,384,368 | -2.7% | 193,354,062 |
| 4 | Port of Savannah | Savannah, Ga. | container, break bulk, heavy lift, automobile, refrigerated | 5,892,131 | 5,613,163 | 5.0% | 38,459,904 |
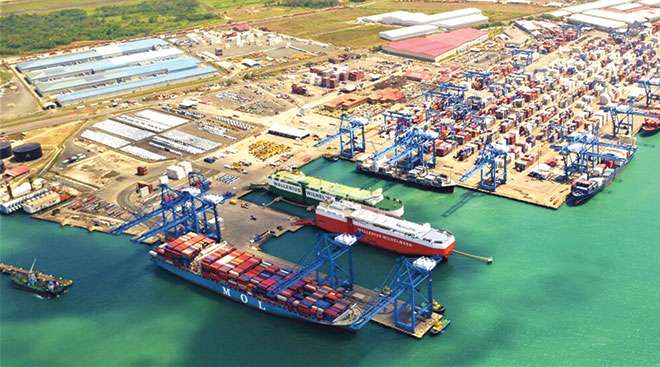
| 5 | Ports of Colon, Cristobal and Manzanillo | Colón, Panama | container, liquid bulk, dry bulk, passenger, transshipping | 5,058,556 | 4,915,975 | 2.9% | |
| 6 | Port Houston | Houston | container, break bulk, dry bulk, liquid bulk | 3,974,901 | 3,453,226 | 15.1% | 49,950,465 |
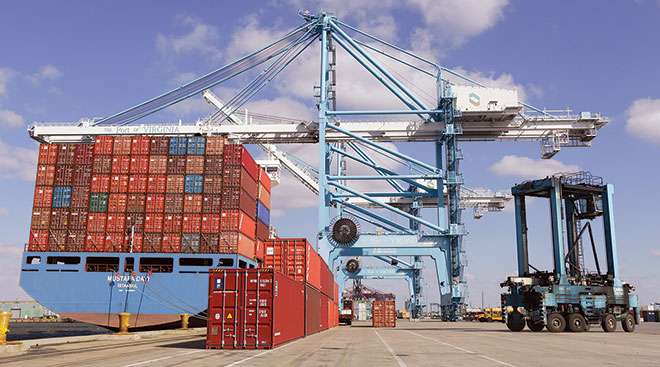
| 7 | Port of Virginia | Norfolk, Va. | container, break bulk, dry bulk, liquid bulk, automobile | 3,703,231 | 3,522,834 | 5.1% | 59,398,828 |
| 8 | Port of Vancouver | Vancouver, British Columbia | container, break bulk, dry bulk, liquid bulk, automobile, special project cargo, passenger | 3,557,294 | 3,678,952 | -3.3% | 142,469,186 |
| 9 | Port of Manzanillo | Manzanillo, Colima, Mexico | container, dry bulk, liquid bulk | 3,473,852 | 3,371,438 | 3.0% | 34,434,272 |
| 10 | Northwest Seaport Alliance | Seattle and Tacoma, Wash. | container, break bulk, liquid bulk, dry bulk, automobile, heavy lift, special project cargo, refrigerated, passenger, air cargo | 3,384,018 | 3,736,206 | -9.4% | 24,551,174 |
| 11 | Port of Balboa/PSA Panama International Terminal | Panama Int'l Terminals, Panama | container, transshipping | 3,347,861 | 3,561,432 | -6.0% | |
| 12 | Port of Charleston | Charleston, S.C. | container, break bulk, dry bulk, automobile, refrigerated | 2,792,313 | 2,751,442 | 1.5% | |
| 13 | Port of Oakland | Oakland, Calif. | container | 2,337,607 | 2,448,243 | -4.5% | |
| 14 | Port of Kingston | Kingston, Jamaica | container, heavy lift, liquid bulk | 2,137,500 | 1,975,401 | 8.2% | |
| 15 | Port of Montreal | Montreal | container, break bulk, dry bulk, liquid bulk, passenger | 1,722,704 | 1,728,114 | -0.3% | 35,997,337 |
| 16 | Port of Lázaro Cárdenas | Lázaro Cárdenas, Michoacán, Mexico | container, break bulk, dry bulk, liquid bulk, transshipping | 1,700,000 | 1,686,076 | 0.8% | |
| 17 | Port of Freeport | Freeport, Bahamas | container, passenger | 1,574,200 | 1,642,780 | -4.2% | |
| 18 | Port of Caucedo | Caucedo, Dominican Republic | container, refrigerated, transshipping | 1,406,500 | 1,250,000 | 12.5% | |
| 19 | Port of San Juan | San Juan, Puerto Rico | container | 1,398,600 | 1,438,738 | -2.8% | |
| 20 | Port of Jacksonville^ | Jacksonville, Fla. | container, break bulk, dry bulk, liquid bulk, automobile, heavy lift, refrigerated | 1,298,132 | 1,407,310 | -7.8% | 9,101,666 |
| 21 | Port Miami^ | Miami | container, passenger | 1,197,663 | 1,254,062 | -4.5% | 9,267,587 |
| 22 | Moín Container Terminal | Límon, Costa Rica | container | 1,182,854 | 1,319,372 | -10.3% | |
| 23 | Port Everglades | Broward County, Fla. | container, break bulk, dry bulk, liquid bulk, passenger | 1,107,546 | 1,038,179 | 6.7% | 24,129,601 |
| 24 | Port of Baltimore | Baltimore | container, break bulk, dry bulk, liquid bulk, automobile, refrigerated, passenger | 1,069,421 | 1,022,683 | 4.6% | 10,307,241 |
| 25 | Port of Prince Rupert | Prince Rupert, British Columbia | container, break bulk, dry bulk, liquid bulk, special project cargo, passenger | 1,035,639 | 1,054,836 | -1.8% | 24,593,720 |
| NOTE: Data for the ports of Kingston, Freeport, Caucedo and San Juan are via PortEconomics. Data for the Port of Lázaro Cárdenas is via the American Journal of Transportation. All other data is via port authorities. * Freight tonnage for the Port of Los Angeles is for fiscal year 2021-22, ended June 30, 2022. ^ Data for the Port of Jacksonville and Port Miami is for fiscal year 2021-22, ended Sept. 30, 2022. |
|||||||
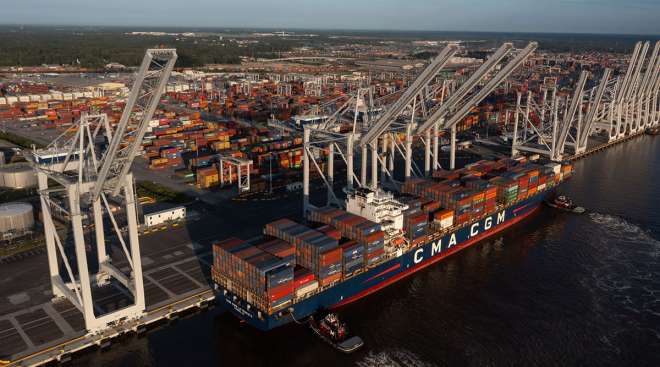
Shipping Giant CMA CGM Posts Loss as Red Sea Conflict Rages
CMA CGM SA posted its first quarterly loss in four years as the shipping industry struggles with the conflict in the Red Sea and the specter of overcapacity.
February 23, 2024Port of Mobile to Build Container Facility in North Alabama
The Alabama Port Authority and CSX Transportation announced that Decatur, Ala., will be home to a new intermodal container transfer facility to connect north Alabama to the Port of Mobile.
February 8, 2024Maersk Warns of Slowdown Once Freight Boost Fades
A.P. Moller-Maersk A/S shares plunged after the company said it expects renewed gloom in the industry this year when the current boost to freight rates from the Red Sea conflict evaporates.
February 8, 2024Cincinnati Airport Deploys Autonomous Baggage Handling EVs
Cincinnati/Northern Kentucky International Airport is using devices known as Auto-DollyTugs, electric autonomous vehicles complete with “robotic arms,” to handle baggage and cargo.
February 6, 2024Amazon Beats Revenue and Profit Expectations for Q4
Amazon on Feb. 1 reported better-than-expected revenue and profits for the fourth quarter, driven by strong consumer spending during the holiday shopping season.
February 2, 2024Container Boom Leads to Q4 Earnings Dip at Hapag-Lloyd
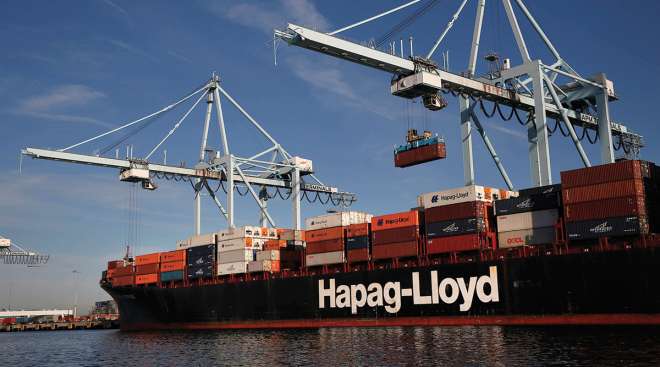
HAMBURG, Germany — The sharp drop in freight prices following the pandemic has caused a slump in sales and profits at German container shipping company Hapag-Lloyd.
January 31, 2024Georgia Ports Handled Record Number of Automobiles in 2023
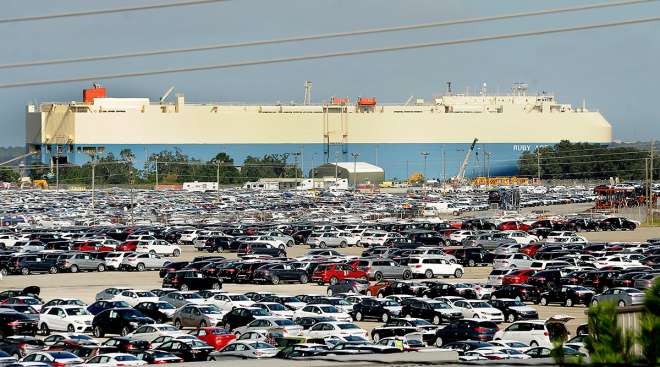
SAVANNAH, Ga. — The Georgia Ports Authority said that it moved a record number of automobiles across its docks in Brunswick in 2023, while goods sent to Savannah in containers declined 16%.
January 30, 2024Freight Elite Struggle to Hit Climate Goals as Demand Surges
Although there are signs of progress, the largest delivery companies have scaled back climate pledges and the industry isn’t keeping pace with climbing emissions from a global demand surge.
January 30, 2024Norfolk Southern Piloting Anonymous Employee Safety Hotline
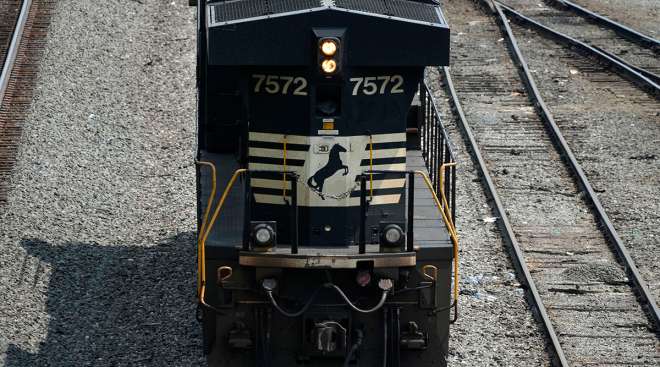
OMAHA, Neb. — About 1,000 engineers and conductors who work for Norfolk Southern soon will be able to report safety concerns anonymously through a federal system without fear of discipline.
January 30, 2024Maersk Unveils World’s Biggest Methanol-Powered Containership
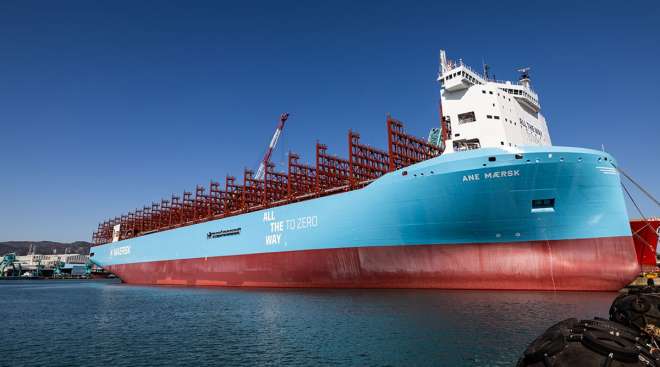
A.P. Moller-Maersk A/S’s newest methanol-powered vessel will soon set sail from South Korea as the shipper seeks to reduce emissions in one of the world’s most-polluting industries.
January 26, 2024

