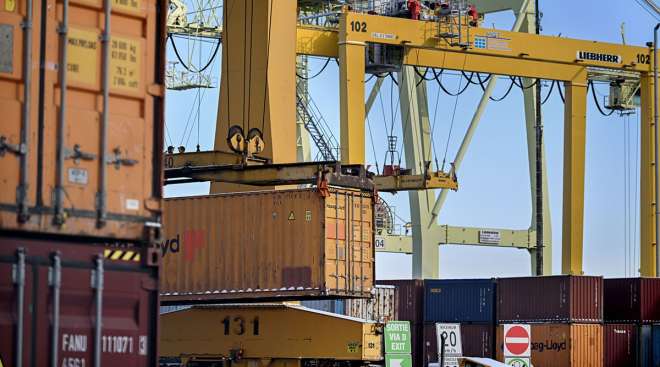
Infrastructure and automation improvements have helped port operators, but there is still more work to be done.

A new No. 1 leads off this year’s Transport Topics Top 50 list of the world’s largest freight companies.
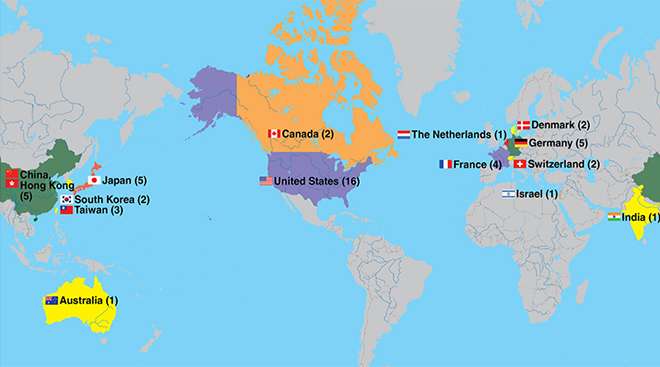
Get a continent-by-continent and country- by-country look at where the Top 50 Global Freight Companies are based.
Rankings
Port Data
| Rank | Port Name | City | Type of Freight | TEUs 2022 | TEUs 2021 | % Change | Freight Tonnage (metric tons) |
|---|---|---|---|---|---|---|---|
| 1 | Port of Los Angeles | Los Angeles | container, break bulk, dry bulk, liquid bulk, automotive, heavy lift, special project cargo, refrigerated, passenger | 9,911,159 | 10,677,610 | -7.2% | 219,000,000* |
| 2 | Port of New York and New Jersey | New York | container, break bulk, dry bulk, liquid bulk, automotive, heavy lift, special project cargo, refrigerated, passenger | 9,493,664 | 8,985,929 | 5.7% | |
| 3 | Port of Long Beach | Long Beach, Calif. | container, break bulk, dry bulk, liquid bulk, automotive, heavy lift, special project cargo, refrigerated, passenger | 9,133,657 | 9,384,368 | -2.7% | 193,354,062 |
| 4 | Port of Savannah | Savannah, Ga. | container, break bulk, heavy lift, automobile, refrigerated | 5,892,131 | 5,613,163 | 5.0% | 38,459,904 |
| 5 | Ports of Colon, Cristobal and Manzanillo | Colón, Panama | container, liquid bulk, dry bulk, passenger, transshipping | 5,058,556 | 4,915,975 | 2.9% | |
| 6 | Port Houston | Houston | container, break bulk, dry bulk, liquid bulk | 3,974,901 | 3,453,226 | 15.1% | 49,950,465 |
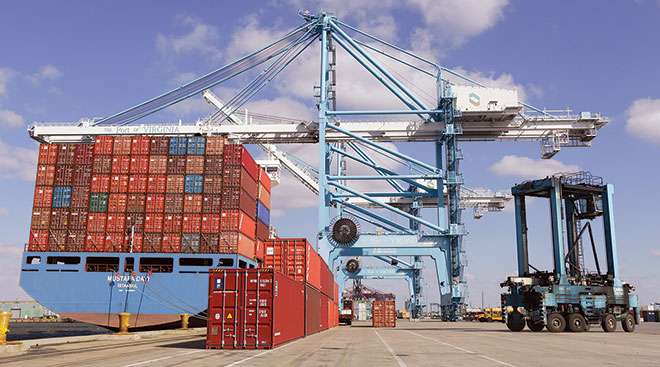
| 7 | Port of Virginia | Norfolk, Va. | container, break bulk, dry bulk, liquid bulk, automobile | 3,703,231 | 3,522,834 | 5.1% | 59,398,828 |
| 8 | Port of Vancouver | Vancouver, British Columbia | container, break bulk, dry bulk, liquid bulk, automobile, special project cargo, passenger | 3,557,294 | 3,678,952 | -3.3% | 142,469,186 |
| 9 | Port of Manzanillo | Manzanillo, Colima, Mexico | container, dry bulk, liquid bulk | 3,473,852 | 3,371,438 | 3.0% | 34,434,272 |
| 10 | Northwest Seaport Alliance | Seattle and Tacoma, Wash. | container, break bulk, liquid bulk, dry bulk, automobile, heavy lift, special project cargo, refrigerated, passenger, air cargo | 3,384,018 | 3,736,206 | -9.4% | 24,551,174 |
| 11 | Port of Balboa/PSA Panama International Terminal | Panama Int'l Terminals, Panama | container, transshipping | 3,347,861 | 3,561,432 | -6.0% | |
| 12 | Port of Charleston | Charleston, S.C. | container, break bulk, dry bulk, automobile, refrigerated | 2,792,313 | 2,751,442 | 1.5% | |
| 13 | Port of Oakland | Oakland, Calif. | container | 2,337,607 | 2,448,243 | -4.5% | |
| 14 | Port of Kingston | Kingston, Jamaica | container, heavy lift, liquid bulk | 2,137,500 | 1,975,401 | 8.2% | |
| 15 | Port of Montreal | Montreal | container, break bulk, dry bulk, liquid bulk, passenger | 1,722,704 | 1,728,114 | -0.3% | 35,997,337 |
| 16 | Port of Lázaro Cárdenas | Lázaro Cárdenas, Michoacán, Mexico | container, break bulk, dry bulk, liquid bulk, transshipping | 1,700,000 | 1,686,076 | 0.8% | |
| 17 | Port of Freeport | Freeport, Bahamas | container, passenger | 1,574,200 | 1,642,780 | -4.2% | |
| 18 | Port of Caucedo | Caucedo, Dominican Republic | container, refrigerated, transshipping | 1,406,500 | 1,250,000 | 12.5% | |
| 19 | Port of San Juan | San Juan, Puerto Rico | container | 1,398,600 | 1,438,738 | -2.8% | |
| 20 | Port of Jacksonville^ | Jacksonville, Fla. | container, break bulk, dry bulk, liquid bulk, automobile, heavy lift, refrigerated | 1,298,132 | 1,407,310 | -7.8% | 9,101,666 |
| 21 | Port Miami^ | Miami | container, passenger | 1,197,663 | 1,254,062 | -4.5% | 9,267,587 |
| 22 | Moín Container Terminal | Límon, Costa Rica | container | 1,182,854 | 1,319,372 | -10.3% | |
| 23 | Port Everglades | Broward County, Fla. | container, break bulk, dry bulk, liquid bulk, passenger | 1,107,546 | 1,038,179 | 6.7% | 24,129,601 |
| 24 | Port of Baltimore | Baltimore | container, break bulk, dry bulk, liquid bulk, automobile, refrigerated, passenger | 1,069,421 | 1,022,683 | 4.6% | 10,307,241 |
| 25 | Port of Prince Rupert | Prince Rupert, British Columbia | container, break bulk, dry bulk, liquid bulk, special project cargo, passenger | 1,035,639 | 1,054,836 | -1.8% | 24,593,720 |
| NOTE: Data for the ports of Kingston, Freeport, Caucedo and San Juan are via PortEconomics. Data for the Port of Lázaro Cárdenas is via the American Journal of Transportation. All other data is via port authorities. * Freight tonnage for the Port of Los Angeles is for fiscal year 2021-22, ended June 30, 2022. ^ Data for the Port of Jacksonville and Port Miami is for fiscal year 2021-22, ended Sept. 30, 2022. |
|||||||

2022 saw an eastern shift in North American ocean freight, while airfreight dipped across the continent.
If your company appears on the list, you have a few ways to announce it. Visit our logo library to get web- and print-ready graphics.

Learn more about Transport Topics’ Top 50 Global Freight Companies publication.
Union Pacific Profit Up 1% in Q4 as Deliveries Rise
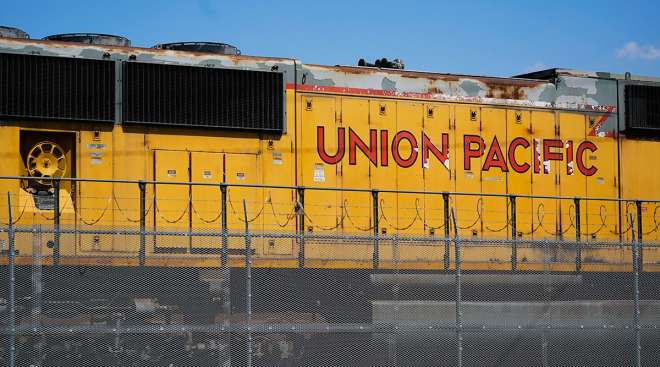
OMAHA, Neb. — Union Pacific’s fourth-quarter profit crept up 1% as the railroad delivered more fertilizer, imported goods and vehicles.
January 25, 2024Canadian National Railway Maintains Earnings Growth Forecast
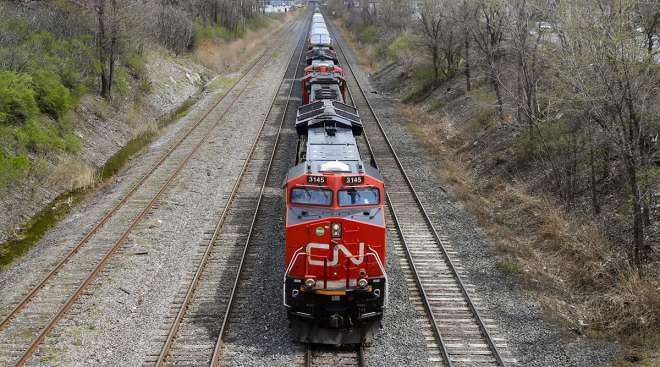
Canadian National Railway is sticking with its outlook for double-digit profit growth over the next few years, moving past a 2023 marred by labor strife, low grain shipments and a sluggish economy.
January 24, 2024USPS Installs EV Chargers in Atlanta, Will Expand Nationwide

This week, USPS unveiled its first set of EV charging stations at its South Atlanta Sorting and Delivery Center, the first of hundreds that will be installed at centers nationwide this year.
January 23, 2024Red Sea Chaos Starting to Impair Profits Across Industries
With the Red Sea crisis roiling shipments of everything from cars to energy, it’s a matter of time before soaring costs and supply chain strains show up in companies’ earnings reports.
January 23, 2024STB Calls for Status Hearing on Gulf Coast Amtrak Project

The U.S. Surface Transportation Board, which oversaw hearings into the possible restart of Gulf Coast rail during 2022, is calling the parties involved in the case for a status hearing.
January 22, 2024Red Sea Attacks Disrupt Food Trade, Risk Higher Grocery Costs

Chaos in the Red Sea is starting to disrupt shipments of produce from coffee to fruit — and threatening to halt a slowdown in food inflation that brought some relief to strained consumers.
January 19, 2024CMA CGM, Subsidiary Ceva to Buy UK Logistics Firm Wincanton

French shipping giant CMA CGM SA agreed to buy U.K. logistics company Wincanton Plc, part of the billionaire Saade family’s buying spree to diversify its transport operations.
January 19, 2024Maersk, Hapag-Lloyd to Operate Some Ships as Joint Fleet
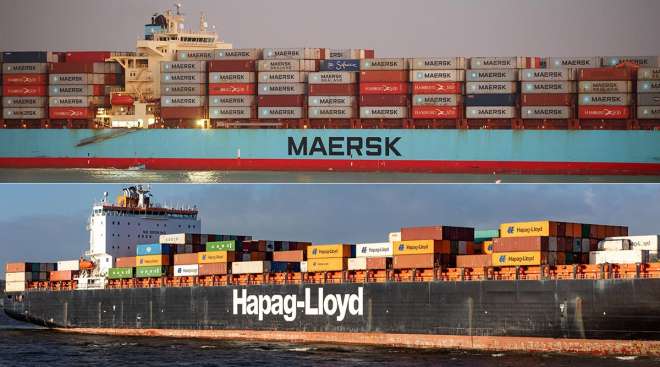
Global shipping giants Hapag-Lloyd and Maersk have struck a partnership deal to operate some of their ships as a joint fleet in the future, the companies announced Jan. 17.
January 17, 2024Shipping CEOs See No Short-Term End to Red Sea Disruptions

The CEOs of two leading freight carriers said they expect Red Sea threats to disrupt shipping for weeks or months longer.
January 17, 2024How the Red Sea Conflict Is Crimping Global Trade
The attacks on commercial ships in the Red Sea by Houthi rebels have rerouted most of the trade normally flowing through the crucial maritime artery for consumer goods and energy supplies.
January 12, 2024-

2023
-
2022
-
2021
-
2020
-
2019
-
2018
-
2017
-
2016
-
2015