


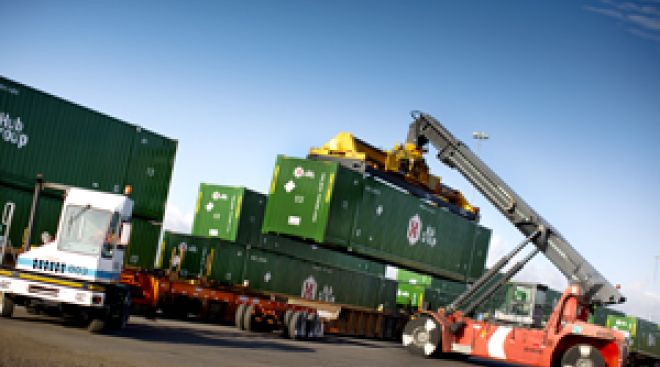
Total container volume at the Port of Los Angeles rose 3.7% in April from a year ago, the 15th consecutive month of growth, the port said.
May 13, 2011Sponsored by:
2015 Essential Financial and Operating Information for the 50 largest logistics companies in the U.S. and Canada
Up Front

FedEx, C.H. Robinson Worldwide make acquisitions, move up in the 2015 Top 50 list.
Over the past 10 years, $36.7 billion has been spent to acquire logistics companies in North America, according to data from Armstrong and Associates. And industry and investment experts believe that the buying is just getting started.
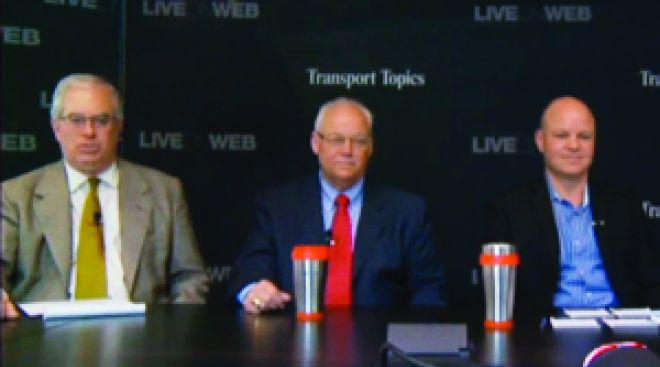
Video: A new set of Transport Topics Top 50 Logistics Companies rankings has been released, and we lined up a quintet of industry leaders to help analyze the latest trends for a LiveOnWeb program.
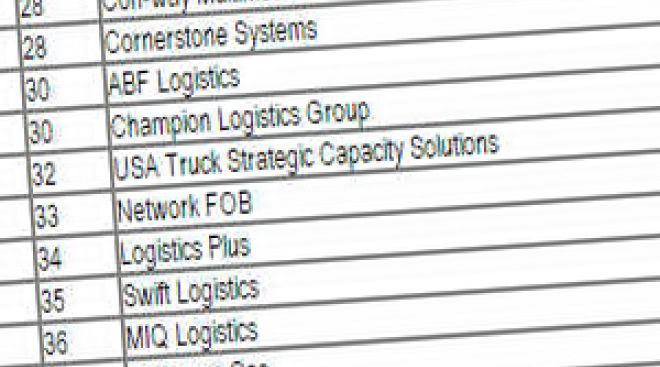
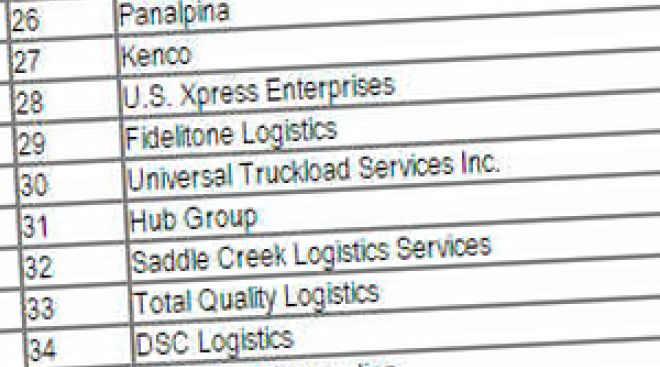
Rankings
| Rank This Year | Rank Last Year | Company | Net Revenue (Millions) | Gross Revenue (Millions) | Employees |
|---|---|---|---|---|---|
| 1 | 1 | UPS Supply Chain Solutions | $3,030 est
|
$5,758 | - |
| 2 | 2 | J.B. Hunt Transport Services | $2,605 est
|
$5,799 | - |
| 3 | 4 | Ryder Supply Chain Solutions | $2,157 est
|
$2,461 | - |
| 4 | 6 | C.H. Robinson Worldwide | $2,131 est
|
$14,093 | 11,521 |
| 5 | 5 | Expeditors International of Washington | $1,981 est
|
$6,565 | 14,659 |
| 6 | 3 | DHL Supply Chain | $1,815 est
|
$3,300 | 47,000 |
| 7 | 7 | Ceva Logistics (North America) | $1,715 est
|
$2,618 | - |
| 8 | 8 | Americold Logistics | $1,696 est
|
- | 11,000 |
| 9 | 9 | UTi Worldwide | $1,548 est
|
$4,369 | 21,018 |
| 10 | 13 | FedEx Logistics | $1,465 est
|
$2,896 | 10,885 |
| 11 | 10 | Schneider | $1,242 est
|
$3,393 | - |
| 12 | 12 | XPO Logistics | $1,160 est
|
$3,140 | - |
| 13 | 11 | Kuehne + Nagel Americas | $1,105 est
|
$5,157 | - |
| 14 | 16 | Swift Transportation | $1,045 est
|
$1,394 | - |
| 15 | 20 | Penske Logistics | $915 est
|
$1,137 | 10,882 |
| 16 | 15 | NFI | $914 est
|
$1,091 | - |
| 17 | 17 | Werner Enterprises | $844 est
|
$1,182 | 4,632 |
| 18 | 19 | Ruan | $805 est
|
$848 | 5,595 |
| 19 | 19 | Neovia Logistics | $800 est
|
- | - |
| 20 | 18 | DB Schenker (North America) | $774 est
|
$2,615 | 6,000 |
| 21 | 22 | Menlo Logistics | $749 est
|
$1,718 | 8,500 |
| 22 | 23 | Cardinal Logistics | $681 est
|
- | - |
| 23 | 14 | APL Logistics (North America) | $660 est
|
$1,030 | 6,000 |
| 24 | 26 | OHL | $650 est
|
$1,305 | 8,302 |
| 25 | 24 | Norbert Dentressangle | $601 est
|
$781 | 6,500 |
| 26 | 36 | Panalpina Inc. | $538 est
|
$2,463 | - |
| 27 | 28 | Kenco Group | $506 est
|
$518 | 3,800 |
| 28 | 27 | U.S. Xpress Enterprises | $475 est
|
$618 | - |
| 29 | 29 | Fidelitone | $454 est
|
$463 | 715 |
| 30 | 31 | Universal Logistics Holdings | $449 est
|
- | - |
| 31 | 32 | Hub Group | $370 est
|
$3,571 | 2,568 |
| 32 | 33 | Saddle Creek Logistics Services | $358 est
|
- | 2,453 |
| 33 | 37 | Total Quality Logistics | $352 est
|
$2,142 | 3,131 |
| 34 | 34 | DSC Logistics | $340 est
|
- | - |
| 35 | 35 | Toll Global Forwarding | $297 est
|
$1,468 | - |
| 36 | 44 | Landstar System | $270 est
|
$1,624 | - |
| 37 | 39 | Performance Team | $261 est
|
$263 | 3,845 |
| 38 | 38 | Burris Logistics | $256 est
|
- | - |
| 39 | 41 | Coyote Logistics | $255 est
|
$2,094 | 1,994 |
| 40 | 40 | BDP International | $254 est
|
$1,900 | - |
| 41 | 43 | Cowan Logistics | $240 est
|
$346 | - |
| 42 | 42 | Preferred Freezer Services | $225 est
|
$275 | 1,800 |
| 43 | 45 | SCI Group | $212 est
|
$213 | 1,800 |
| 44 | 46 | Averitt Express | $210 est
|
$365 | - |
| 45 | 50 | Echo Global Logistics | $208 est
|
$1,173 | 1,734 |
| 46 | 47 | Damco International | $185 est
|
$1,007 | - |
| 47 | Crane Worldwide Logistics | $183 est
|
$689 | - | |
| 48 | 49 | Legacy Supply Chain Services | $180 est
|
$401 | - |
| 48 | Odyssey Logistics & Technology | $180 est
|
$590 | - | |
| 50 | 48 | Agility Logistics | $175 est
|
$795 | - |
About the Rankings...
Top 50 Logistics Companies provide logistics services, including freight brokerage, freight forwarding, warehousing and dedicated contract carriage in North America and are ranked on the basis of annual gross revenue. Some sector rankings may have been updated since their print publication. To be included in the Top 50 list, please send contact information to tteditor@ttnews.com. We will contact you via phone or e-mail to get information about your company prior to publication of the next Top 50 list.

Extras
If all you’re looking for is the 2015 Top 50 Logistics Companies and their rank, here they are in a simple, clean table form.
51
On the Bubble
Dupre Logistics
($157 million), Lafayette, Louisiana, provides dedicated contract carriage services.
Here is the list of Transport Topics 2015 Top Warehousing Firms and Dedicated Contract Carriers.
If your company appears in the 2015 list, you have a few ways to announce it! Visit our logo library to get web- and print-ready graphics.
Here is the list of Transport Topics 2015 Top Ocean Freight and Airfreight Forwarders.
Logistics News
Business, Government, Logistics

Port of L.A. Container Volume Rises 3.7% in April
Business, Logistics

Weekly Intermodal Traffic Rises 11.2%
Intermodal traffic rose 11.2% last week from a year ago, the Association of American Railroads said.
May 13, 2011Business, Logistics
Horizon Lines Reports $33.3 Million 1Q Loss
Horizon Lines Inc., the ocean carrier that provides service between the U.S. mainland and Alaska as well as other locations, said it lost $33.3 million in the fiscal first quarter ended March 27, a loss that was nearly three times greater than the comparable 2010 period.
May 9, 2011Business, Logistics
Trailer Production in March More Than Doubles From 2010
Both orders and factory production of new commercial trailers more than doubled in March, compared with the same month of 2010 and leading to escalating prices and longer wait times, industry officials have said.
May 9, 2011Business, Logistics
Wabash Swings to First-Quarter Profit
Trailer manufacturer Wabash National Corp. reported a first-quarter profit on improved sales, turning around a loss from a year ago.
May 4, 2011Business, Logistics
North American Trailer Expands in Calif. With Acquisition
North American Trailer said it has acquired Fontana, Calif.-based Quality Fleet Repair, effective Sunday. Terms were not disclosed.
May 3, 2011Business, Logistics
Universal Truckload’s 1Q Profit Improves
Universal Truckload Services’ first-quarter income rose from a year ago as load volumes improved.
April 29, 2011Business, Government, Logistics
Consumer Confidence Increases in April
Consumer confidence rose in April from a 16-month low, according to the Thomson Reuters/University of Michigan consumer sentiment index released Friday.
April 29, 2011Logistics
Norfolk Southern’s 1Q Profit Improves
Norfolk Southern Corp.’s first-quarter profit rose from the same quarter last year on higher freight levels, the Eastern freight railroad said late Wednesday.
April 28, 2011Business, Logistics
Forward Air’s 1Q Income More than Doubles
Forward Air Corp.’s first-quarter net income rose to $7.9 million, or 27 cents a share, from $3.4 million, or 12 cents, a year ago.
April 21, 2011Archives
-

2023
-
2022
-
2021
-
2020
-
2019
-
2018
-
2017
-
2016
-
2015
-
2014
-
2013
-
2012
-
2011
-
2010
-
2009
-
2008
-
2007
-
2006
-
2005


