The Technology & Maintenance Council will host its Fall Meeting and SuperTech event Sept. 21-24 in Orlando, Florida.
September 14, 2015Sponsored by:
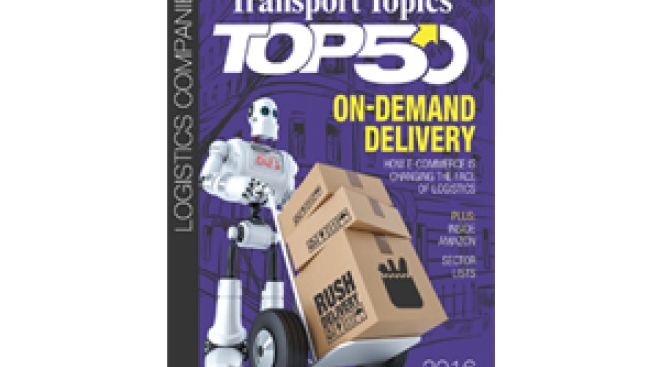
2016 Essential Financial and Operating Information for the 50 largest logistics companies in the U.S. and Canada
Up Front
Learn how to be included in the 2017 Top 50 Logistics Companies listing.
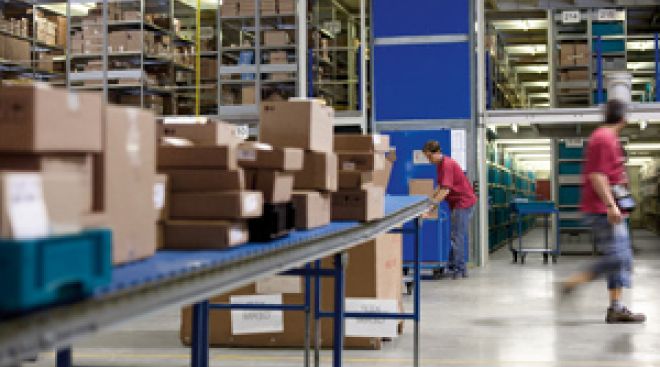
As online sales continue to soar, so have the expectations of consumers for goods to be delivered quickly and cheaply.
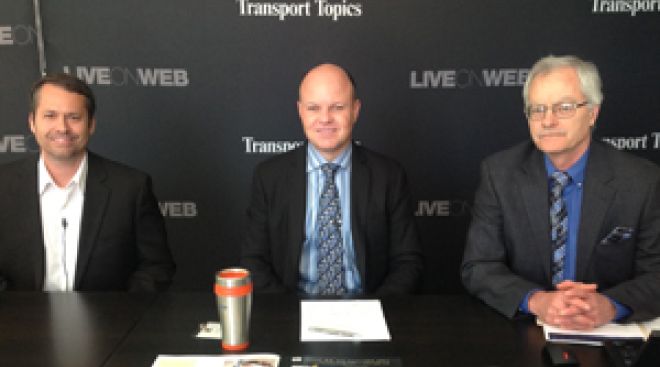
Our April 20 LiveOnWeb webcast looked at how online shopping is creating enormous disruption to freight networks and modes of delivery. Plus we looked back at the new TT Top 50 Logistics Companies rankings. Watch the replay.
Rankings
| Rank This Year | Rank Last Year | Company | Net Revenue (Millions) | Gross Revenue (Millions) | Employees |
|---|---|---|---|---|---|
| 1 | 1 | UPS Supply Chain Solutions | $3,108 est
|
$5,900 | 12,700 |
| 2 | 12 | XPO Logistics | $2,841 est
|
$5,536 | - |
| 3 | 2 | J.B. Hunt Transport Services | $2,660 est
|
$5,816 | - |
| 4 | 4 | C.H. Robinson Worldwide | $2,268 est
|
$13,476 | 13,159 |
| 5 | 5 | Expeditors International of Washington | $2,188 est
|
$6,617 | 15,397 |
| 6 | 3 | Ryder Supply Chain Solutions | $1,925 est
|
$2,443 | - |
| 7 | 6 | DHL Supply Chain | $1,815 est
|
$3,300 | - |
| 8 | 10 | FedEx Logistics | $1,625 est
|
$3,178 | - |
| 9 | 7 | Ceva Logistics (North America) | $1,570 est
|
$2,452 | - |
| 10 | 8 | Americold Logistics | $1,555 est
|
- | - |
| 11 | 9 | UTi Worldwide | $1,330 est
|
$3,696 | - |
| 12 | 11 | Schneider | $1,275 est
|
$3,480 | - |
| 13 | 13 | Kuehne + Nagel Americas | $1,197 est
|
$5,230 | - |
| 14 | 15 | Penske Logistics | $1,150 est
|
$1,430 | 13,750 |
| 15 | 16 | NFI | $1,130 est
|
$1,200 | 8,101 |
| 16 | 14 | Swift Transportation | $1,065 est
|
$1,418 | 120 |
| 17 | 20 | DB Schenker (North America) | $898 est
|
$2,687 | - |
| 18 | 19 | Neovia Logistics | $860 est
|
- | - |
| 19 | 17 | Werner Enterprises | $826 est
|
$1,052 | 4,933 |
| 20 | 18 | Ruan | $816 est
|
$869 | 5,558 |
| 21 | Lineage Logistics | $800 est
|
- | - | |
| 22 | 24 | OHL | $732 est
|
$1,470 | 8,000 |
| 23 | 22 | Cardinal Logistics | $681 est
|
- | - |
| 24 | 23 | APL Logistics (North America) | $660 est
|
$1,030 | 6,000 |
| 25 | 27 | Kenco Group | $535 est
|
$582 | 3,800 |
| 26 | 26 | Panalpina Inc. | $459 est
|
$2,784 | - |
| 27 | 33 | Total Quality Logistics | $446 est
|
$2,240 | 3,791 |
| 28 | 30 | Universal Logistics Holdings | $444 est
|
- | - |
| 29 | 31 | Hub Group | $413 est
|
$3,526 | 2,633 |
| 30 | 34 | DSC Logistics | $405 est
|
- | - |
| 31 | 32 | Saddle Creek Logistics Services | $390 est
|
- | 2,587 |
| 32 | 28 | U.S. Xpress Enterprises | $351 est
|
$508 | - |
| 33 | 40 | BDP International | $297 est
|
$1,900 | - |
| 34 | 36 | Landstar System | $292 est
|
$1,760 | 1,223 |
| 35 | 45 | Echo Global Logistics | $290 est
|
$1,512 | 2,335 |
| 36 | 35 | Toll Global Forwarding | $285 est
|
$1,448 | - |
| 37 | 37 | Performance Team | $278 est
|
$279 | 4,300 |
| 38 | 38 | Burris Logistics | $275 est
|
$3,524 | - |
| 39 | 42 | Preferred Freezer Services | $265 est
|
$324 | 1,525 |
| 40 | Apex Logistics International | $255 est
|
$613 | - | |
| 41 | 41 | Cowan Logistics | $252 est
|
$347 | 1,258 |
| 42 | 29 | Fidelitone | $235 est
|
$245 | 690 |
| 43 | Estenson Logistics | $226 est
|
$226 | - | |
| 44 | 47 | Crane Worldwide Logistics | $217 est
|
$654 | - |
| 45 | 44 | Averitt Express | $204 est
|
$396 | - |
| 46 | WWEX Group | $200 est
|
$750 | - | |
| 47 | Port Logistics Group | $190 est
|
$200 | 2,500 | |
| 48 | Radiant Logistics | $189 est
|
$872 | - | |
| 49 | 43 | SCI Group | $187 est
|
$189 | - |
| 50 | 50 | Agility Logistics | $180 est
|
$774 | - |
| 50 | 48 | Odyssey Logistics & Technology | $180 est
|
$590 | - |
About the Rankings...
Top 50 Logistics Companies provide logistics services, including freight brokerage, freight forwarding, warehousing and dedicated contract carriage in North America and are ranked on the basis of annual gross revenue. Some sector rankings may have been updated since their print publication. To be included in the Top 50 list, please send contact information to tteditor@ttnews.com. We will contact you via phone or e-mail to get information about your company prior to publication of the next Top 50 list.

Extras
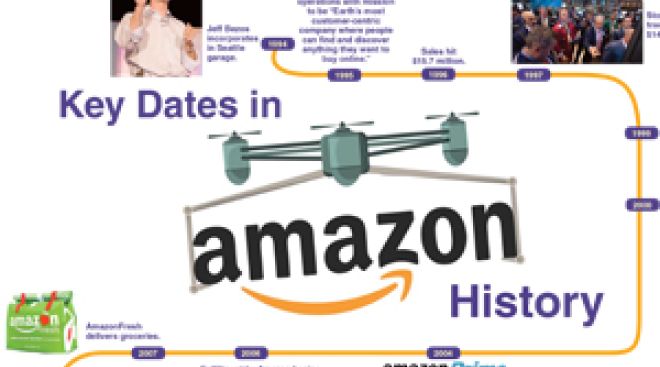
A former Transport Topics editor who worked at Amazon examines the hustle and bustle of the online retailer.
56
On the Bubble
Verst Group
($156 million), Walton, Ky., provides air and ocean freight forwarding, customs brokerage, dedicated contract carriage, freight brokerage, freight payment and auditing, intermodal and drayage, inventory management and packaging, order fulfillment, returned goods management, supply chain consulting, transportation management and warehousing and distribution.
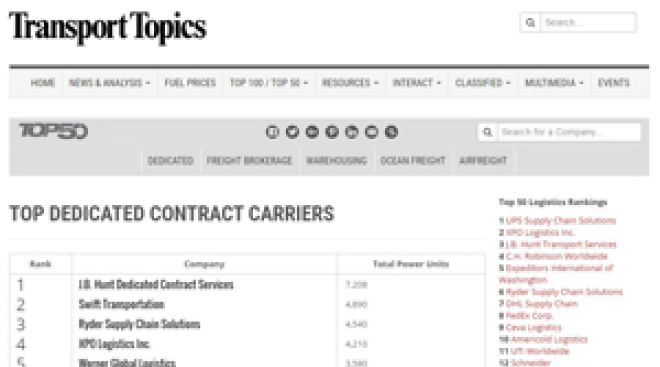
Visit our new sector pages for top brokerage firms, warehousing firms, dedicated contract carriers, ocean freight forwarders and airfreight forwarders.
If your company appears in the 2016 list, you have a few ways to announce it! Visit our logo library to get web- and print-ready graphics.
Learn more about Transport Topics' Top 50 Logistics Companies Publication.
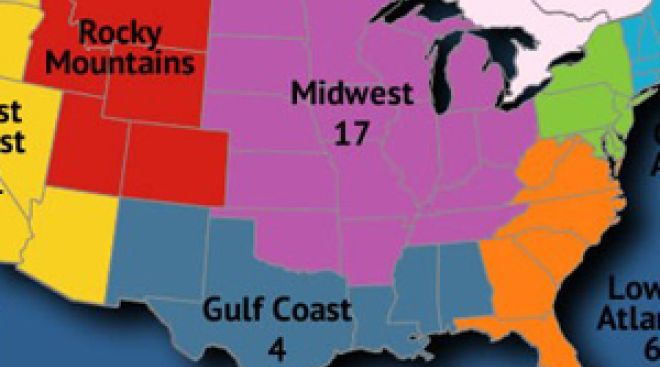
Find out where the carriers are by regions and by state in North America with our interactive map.
Logistics News
Business, Government, Logistics, Autonomous
XPO to Purchase Con-way
XPO Logistics Inc. last week agreed to buy Con-way Inc. for $3 billion — the highest price ever paid for a U.S. trucking company — to broaden its service offerings and leap into the less-than-truckload market.
September 14, 2015Business, Logistics, Autonomous
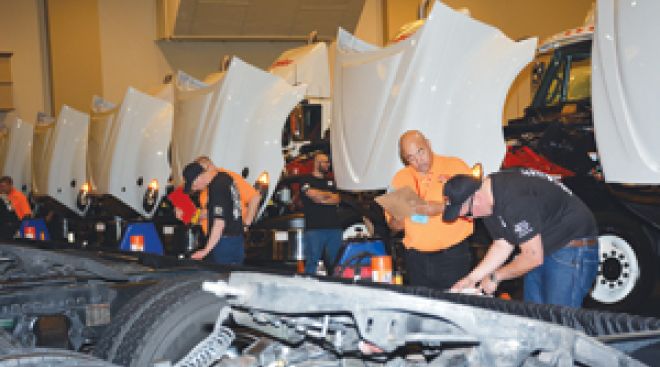
Top Truck Technicians to Go Wrench-to-Wrench in National Championship at TMC Fall Meeting
Business, Logistics

Analysts View XPO’s Latest Transaction as a Reversal of Fortune for Con-way
Investment analysts and observers greeted the news that XPO Logistics acquired Con-way Inc. for $3 billion as a likely positive step for both companies, but especially for beleaguered Con-way.
September 14, 2015Business, Government, Safety, Logistics, Autonomous

Canadian Truckers Leery Of Copying US Plan on GHG
The head of the Canadian Trucking Alliance said he hopes the nation will develop a greenhouse-gas rule that reflects unique operations there and is not simply a clone of the U.S. proposal that is expected to be finalized next year.
September 14, 2015Business, Logistics

Con-Way's Menlo Logistics is 'Crown Jewel' of XPO's Acquisition
XPO Logistics said it has agreed to acquire Con-way Inc. for $3 billion to broaden its supply chain offerings into less-than-truckload and U.S. truckload freight and create a company with annual revenue of $15 billion.
September 11, 2015Business, Logistics

How Startups are Using Big Data to Manage the Holiday Cargo Rush
Several startups have sprung up to help manage the complicated flow of data involved with the movement of goods.
September 10, 2015Business, Logistics

Weekly Rail Intermodal Volume Rises 17%
Weekly U.S. intermodal rail traffic rose 17% from the same period last year, the Association of American Railroads reported.
September 10, 2015Government, Business, Safety, Logistics
White House to Appoint Former NY Transportation Chief to Infrastructure Advisory Council
Former New York state Department of Transportation Commissioner Joan McDonald will be appointed to a post on the National Infrastructure Advisory Council, the White House announced in late August.
September 8, 2015Business, Logistics

National Retail Systems, Ikea Launch Electric Drayage Tractor
Logistics provider National Retail Systems Inc. launched a zero-emission electric drayage operation for Ikea Distribution Services North America in Los Angeles.
September 8, 2015Logistics

Norfolk Southern Rolls Out Low-Emission Yard Locomotives
Norfolk Southern Corp. has introduced new locomotives with lower emissions for freight yard service in the Atlanta area.
September 8, 2015Archives
-

2023
-
2022
-
2021
-
2020
-
2019
-
2018
-
2017
-
2016
-
2015
-
2014
-
2013
-
2012
-
2011
-
2010
-
2009
-
2008
-
2007
-
2006
-
2005