The largest U.S. freight railroads reached a tentative agreement last week with a union representing track and bridge maintenance workers, eliminating the possibility of a nationwide work stoppage.
February 3, 2012Sponsored by:
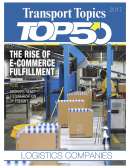
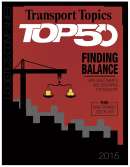
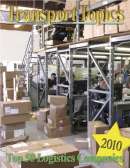
2016 Essential Financial and Operating Information for the 50 largest logistics companies in the U.S. and Canada
Up Front

Learn how to be included in the 2017 Top 50 Logistics Companies listing.

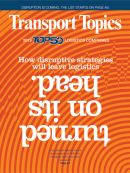
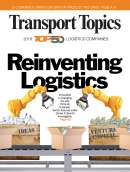
As online sales continue to soar, so have the expectations of consumers for goods to be delivered quickly and cheaply.

Our April 20 LiveOnWeb webcast looked at how online shopping is creating enormous disruption to freight networks and modes of delivery. Plus we looked back at the new TT Top 50 Logistics Companies rankings. Watch the replay.
Rankings
| Rank This Year | Rank Last Year | Company | Net Revenue (Millions) | Gross Revenue (Millions) | Employees |
|---|---|---|---|---|---|
| 1 | 1 | UPS Supply Chain Solutions | $3,108 est
|
$5,900 | 12,700 |
| 2 | 12 | XPO Logistics | $2,841 est
|
$5,536 | - |
| 3 | 2 | J.B. Hunt Transport Services | $2,660 est
|
$5,816 | - |
| 4 | 4 | C.H. Robinson Worldwide | $2,268 est
|
$13,476 | 13,159 |
| 5 | 5 | Expeditors International of Washington | $2,188 est
|
$6,617 | 15,397 |
| 6 | 3 | Ryder Supply Chain Solutions | $1,925 est
|
$2,443 | - |
| 7 | 6 | DHL Supply Chain | $1,815 est
|
$3,300 | - |
| 8 | 10 | FedEx Logistics | $1,625 est
|
$3,178 | - |
| 9 | 7 | Ceva Logistics (North America) | $1,570 est
|
$2,452 | - |
| 10 | 8 | Americold Logistics | $1,555 est
|
- | - |
| 11 | 9 | UTi Worldwide | $1,330 est
|
$3,696 | - |
| 12 | 11 | Schneider | $1,275 est
|
$3,480 | - |
| 13 | 13 | Kuehne + Nagel Americas | $1,197 est
|
$5,230 | - |
| 14 | 15 | Penske Logistics | $1,150 est
|
$1,430 | 13,750 |
| 15 | 16 | NFI | $1,130 est
|
$1,200 | 8,101 |
| 16 | 14 | Swift Transportation | $1,065 est
|
$1,418 | 120 |
| 17 | 20 | DB Schenker (North America) | $898 est
|
$2,687 | - |
| 18 | 19 | Neovia Logistics | $860 est
|
- | - |
| 19 | 17 | Werner Enterprises | $826 est
|
$1,052 | 4,933 |
| 20 | 18 | Ruan | $816 est
|
$869 | 5,558 |
| 21 | Lineage Logistics | $800 est
|
- | - | |
| 22 | 24 | OHL | $732 est
|
$1,470 | 8,000 |
| 23 | 22 | Cardinal Logistics | $681 est
|
- | - |
| 24 | 23 | APL Logistics (North America) | $660 est
|
$1,030 | 6,000 |
| 25 | 27 | Kenco Group | $535 est
|
$582 | 3,800 |
| 26 | 26 | Panalpina Inc. | $459 est
|
$2,784 | - |
| 27 | 33 | Total Quality Logistics | $446 est
|
$2,240 | 3,791 |
| 28 | 30 | Universal Logistics Holdings | $444 est
|
- | - |
| 29 | 31 | Hub Group | $413 est
|
$3,526 | 2,633 |
| 30 | 34 | DSC Logistics | $405 est
|
- | - |
| 31 | 32 | Saddle Creek Logistics Services | $390 est
|
- | 2,587 |
| 32 | 28 | U.S. Xpress Enterprises | $351 est
|
$508 | - |
| 33 | 40 | BDP International | $297 est
|
$1,900 | - |
| 34 | 36 | Landstar System | $292 est
|
$1,760 | 1,223 |
| 35 | 45 | Echo Global Logistics | $290 est
|
$1,512 | 2,335 |
| 36 | 35 | Toll Global Forwarding | $285 est
|
$1,448 | - |
| 37 | 37 | Performance Team | $278 est
|
$279 | 4,300 |
| 38 | 38 | Burris Logistics | $275 est
|
$3,524 | - |
| 39 | 42 | Preferred Freezer Services | $265 est
|
$324 | 1,525 |
| 40 | Apex Logistics International | $255 est
|
$613 | - | |
| 41 | 41 | Cowan Logistics | $252 est
|
$347 | 1,258 |
| 42 | 29 | Fidelitone | $235 est
|
$245 | 690 |
| 43 | Estenson Logistics | $226 est
|
$226 | - | |
| 44 | 47 | Crane Worldwide Logistics | $217 est
|
$654 | - |
| 45 | 44 | Averitt Express | $204 est
|
$396 | - |
| 46 | WWEX Group | $200 est
|
$750 | - | |
| 47 | Port Logistics Group | $190 est
|
$200 | 2,500 | |
| 48 | Radiant Logistics | $189 est
|
$872 | - | |
| 49 | 43 | SCI Group | $187 est
|
$189 | - |
| 50 | 48 | Odyssey Logistics & Technology | $180 est
|
$590 | - |
| 50 | 50 | Agility Logistics | $180 est
|
$774 | - |
About the Rankings...
Top 50 Logistics Companies provide logistics services, including freight brokerage, freight forwarding, warehousing and dedicated contract carriage in North America and are ranked on the basis of annual gross revenue. Some sector rankings may have been updated since their print publication. To be included in the Top 50 list, please send contact information to tteditor@ttnews.com. We will contact you via phone or e-mail to get information about your company prior to publication of the next Top 50 list.

Extras
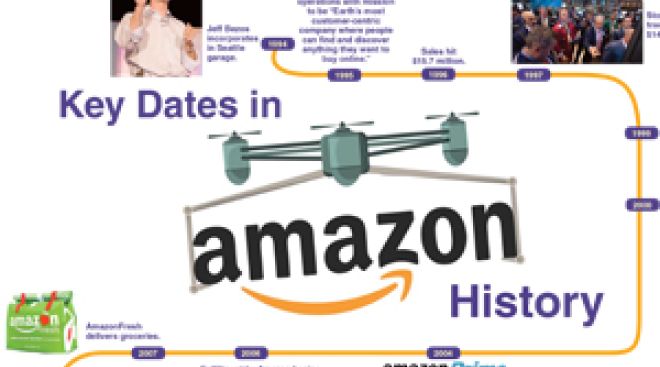
A former Transport Topics editor who worked at Amazon examines the hustle and bustle of the online retailer.
53
On the Bubble
Transplace Inc.
($170 million), Frisco, Texas, provides air and ocean freight forwarding, customs brokerage, freight brokerage freight payment and auditing, intermodal and drayage, supply chain consulting and transportation management.
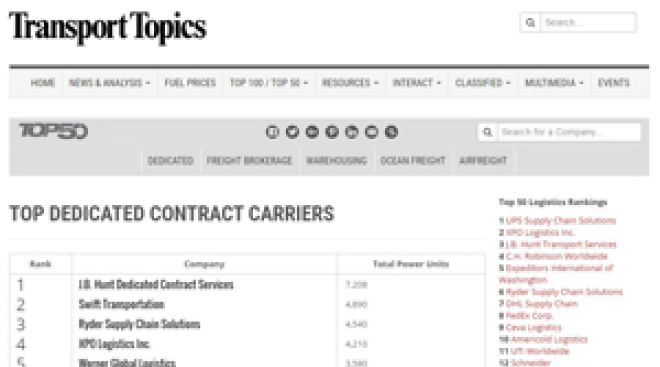
Visit our new sector pages for top brokerage firms, warehousing firms, dedicated contract carriers, ocean freight forwarders and airfreight forwarders.
If your company appears in the 2016 list, you have a few ways to announce it! Visit our logo library to get web- and print-ready graphics.
Learn more about Transport Topics' Top 50 Logistics Companies Publication.
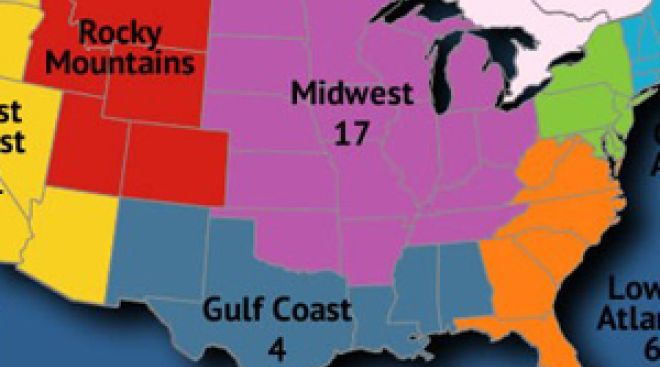
Find out where the carriers are by regions and by state in North America with our interactive map.
Logistics News
Business, Logistics, Equipment
Trailer Orders Keep Rising; Plants Ramp Up Capacity
Trailer makers experienced robust ordering activity to end 2011 and early this year, according to ACT Research Co. and interviews with manufacturers.
February 6, 2012Business, Logistics

Railroads, Union Agree; Possible Strike Averted
Business, Logistics

Weekly Intermodal Traffic Rises 5.5%
U.S. intermodal traffic rose 5.5% for the week ended Saturday from a year ago, the Association of American Railroads reported.
February 3, 2012Business, Logistics
C.H. Robinson Reports Higher 4Q Profit
Transportation and third-party logistics firm C.H. Robinson Worldwide reported a fourth-quarter profit of $109.2 million, or 67 cents a share, up 5.9% from $103.2 million, or 62 cents, a year earlier.
February 2, 2012Business, Logistics
N.C. College to Manage Global Logistics Center
The Piedmont Triad Partnership, a private economic development organization representing 12 counties in North Carolina’s Piedmont region, said it has agreed to turn over management of the North Carolina Center for Global Logistics to Guilford Technical Community College in Jamestown, N.C.
February 2, 2012Business, Government, Logistics
Consumer Confidence Declines
Consumer confidence fell this month, the New York-based Conference Board said Tuesday.
January 31, 2012Business, Logistics
Hub Group’s 4Q, Full-Year Income Rise
Hub Group’s fourth-quarter profit rose on higher intermodal and logistics revenue.
January 30, 2012Perspective, Business, Logistics
Opinion: Don Schneider’s Legacy of Innovation
At Qualcomm, we have been greatly saddened by the news of Don Schneider’s passing. We honor his commitment to innovation and recognize the legacy he leaves the industry.
January 30, 2012Business, Government, Logistics
Consumer Confidence Rises Again
Consumer confidence rose in January to the highest level in almost a year, according to the Thomson Reuters/University of Michigan consumer sentiment index released Friday.
January 27, 2012Business, Logistics

Weekly Intermodal Traffic Rises 3%
U.S. intermodal traffic rose 3% for the week ended Saturday from a year ago, the Association of American Railroads reported.
January 27, 2012Archives
-

2023
-
2022
-
2021
-
2020
-
2019
-
2018
-
2017
-
2016
-
2015
-
2014
-
2013
-
2012
-
2011
-
2010
-
2009
-
2008
-
2007
-
2006
-
2005