| Rank This Year | Rank Last Year | Company | Tractors | Trucks | Pickups/ Cargo Vans | Trailers | Annual Revenue |
|---|---|---|---|---|---|---|---|
| 1 | 1 | PepsiCo Inc. |
12,132 | 7,745 | 17,761 | 10,548 | $66.0 billion |
| 2 | 3 | Sysco Corp. |
7,647 | 1,190 | 388 | 9,577 | $44.4 billion |
| 3 | 2 | Coca-Cola Co. |
7,479 | 1,901 | 3,690 | 9,523 | $46.9 billion |
| 4 | 4 | Wal-Mart Stores |
6,239 | - | - | 61,743 | $473.0 billion |
| 5 | 5 | U.S. Foods |
5,438 | 328 | - | 6,472 | $22.0 billion |
| 6 | 5 | Halliburton Co. |
5,025 | 1,009 | - | 8,437 | $29.0 billion |
| 7 | 7 | McLane Co. |
3,650 | 260 | 38 | 4,867 | $44.0 billion |
| 8 | 8 | Agrium Inc. |
3,395 | 2,379 | 6,817 | 4,431 | $11.9 billion |
| 9 | 10 | Reyes Holdings |
3,052 | 510 | 359 | 3,972 | $20.0 billion |
| 10 | 12 | C $amp;amp; J Energy Services/ Nabor Industries |
3,002 | 1,045 | - | 4,048 | $1.1 billion |
| 11 | 9 | Schlumberger Limited |
2,913 | 1,029 | - | 3,741 | $45.0 billion |
| 12 | 11 | Tyson Foods |
2,873 | 3,305 | - | 7,331 | $34.4 billion |
| 13 | 13 | Dr Pepper Snapple Group |
2,388 | 327 | 1,541 | 3,100 | $6.0 billion |
| 14 | 15 | Performance Food Group |
2,349 | 90 | - | 2,899 | - |
| 15 | 13 | Baker Hughes Inc. |
2,285 | 1,817 | - | 2,845 | $22.0 billion |
| 16 | 14 | Dean Foods Co. |
1,888 | 3,183 | 470 | 5,450 | $9.0 billion |
| 17 | 16 | United Rentals Inc. |
1,879 | 2,984 | - | 2,003 | $5.0 billion |
| 18 | 17 | Basic Energy Services |
1,620 | 386 | - | 1,819 | $1.3 billion |
| 19 | 23 | Gibson Energy Inc. |
1,450 | - | - | 2,600 | $3.7 billion |
| 20 | 19 | Weatherford International |
1,428 | 1,106 | - | 3,513 | $15.3 billion |
| 21 | 21 | Airgas Inc. |
1,407 | 3,081 | 946 | 3,872 | $4.9 billion |
| 22 | 24 | Kroger Co. |
1,370 | 35 | - | 4,249 | $98.0 billion |
| 23 | 25 | Clean Harbors Inc. |
1,351 | 3,825 | 2,934 | 5,210 | $3.5 billion |
| 24 | 22 | Gordon Food Service |
1,339 | 136 | - | 1,888 | - |
| 25 | 20 | CHS Inc. |
1,322 | 1,837 | - | 2,060 | $44.0 billion |
| 26 | - | Calfrac Well Services |
1,236 | - | - | 1,443 | $1.6 billion |
| 27 | 30 | Praxair Inc. |
1,200 | 1,500 | - | 2,200 | $11.9 billion |
| 28 | 28 | Prairie Farms Dairy |
1,086 | 1,322 | 242 | 2,907 | - |
| 29 | 29 | Dot Foods |
1,070 | 1 | 12 | 1,650 | - |
| 30 | 27 | Cemex USA |
997 | 4,896 | - | 1,529 | $3.3 billion |
| 31 | - | Veritiv Corp. |
948 | 76 | 124 | 1,352 | $9.5 billion |
| 32 | 32 | Nestle USA |
896 | 3,678 | - | 1,450 | $10.0 billion |
| 33 | 35 | Plains All American Pipeline |
843 | - | - | 1,726 | $42.0 billion |
| 33 | 26 | Safeway Inc. |
843 | 450 | 87 | 3,224 | $36.0 billion |
| 35 | 39 | Air Products Inc. |
830 | 120 | 400 | 2,100 | $10.2 billion |
| 36 | 33 | Ben E. Keith Co. |
825 | - | - | 1,053 | - |
| 37 | 45 | Walgreen Co. |
811 | 5 | - | 1,794 | $72.2 billion |
| 38 | 46 | Helena Chemical Co. |
809 | 1,937 | - | 2,430 | - |
| 39 | 37 | Pilot Flying J Inc. |
808 | 26 | - | 970 | - |
| 40 | 36 | Kellogg Co. |
800 | - | - | 1,200 | $14.8 billion |
| 41 | 48 | Darling Ingredients |
796 | 748 | - | 3,940 | $4.0 billion |
| 42 | 31 | Nuverra Environmental Solutions |
762 | 379 | - | 1,073 | $0.5 billion |
| 43 | 40 | Shaw Industries Group |
754 | 52 | 234 | 3,319 | $4.0 billion |
| 44 | 18 | Key Energy Services |
691 | 1,099 | - | 1,500 | $1.6 billion |
| 45 | 44 | Lowe's Companies Inc. |
683 | 3,802 | - | 712 | $53.4 billion |
| 46 | 42 | Univar USA |
671 | 74 | - | 1,553 | $10.3 billion |
| 47 | 47 | Albertsons |
670 | - | - | 2,500 | - |
| 48 | 38 | JBS USA Holdings |
638 | - | - | 1,504 | - |
| 49 | 50 | Sunbelt Rentals |
628 | 1,132 | - | 657 | $3.0 billion |
| 50 | 49 | Delhaize America |
625 | - | - | 2,095 | $17.1 billion |
| 50 | 51 | Mondelez International |
625 | 315 | - | 760 | $35.3 billion |
| 52 | 41 | Linde North America |
620 | 3,153 | - | 1,913 | - |
| 53 | 56 | United Natural Foods |
604 | 13 | - | 710 | $6.1 billion |
| 54 | 58 | Ashley Furniture Industries |
596 | 7 | - | 1,953 | $3.0 billion |
| 55 | - | Golden State Foods |
594 | 45 | - | 923 | $6.0 billion |
| 56 | 60 | Publix Super Markets |
590 | 16 | 430 | 2,605 | $28.9 billion |
| 57 | 54 | Land O$amp;#39;Lakes Inc. |
580 | 1,134 | 1,001 | 1,530 | $14.2 billion |
| 58 | 57 | Archer Daniels Midland |
561 | 84 | - | 1,510 | $90.0 billion |
| 58 | 55 | Core-Mark Holding Co. |
561 | 70 | - | 693 | $9.8 billion |
| 60 | 62 | ABC Supply Co. |
560 | 2,000 | 88 | 750 | - |
| 61 | 50 | Advanced Drainage Systems |
550 | - | - | 1,100 | - |
| 62 | 43 | MDU Resources Group |
537 | 1,827 | - | 1,905 | $4.5 billion |
| 63 | 68 | American Air Liquide Holdings |
536 | 74 | - | 1,244 | - |
| 64 | 59 | Food Services of America |
511 | 51 | - | 651 | - |
| 65 | 67 | Bunzl Distribution USA |
510 | 24 | 8 | 820 | - |
| 66 | 53 | H.E.B. Grocery Co. |
505 | 9 | - | 2,844 | - |
| 67 | 52 | Foster Farms |
503 | 138 | - | 1,166 | - |
| 68 | 73 | Patterson-UTI Energy Co. |
500 | 506 | - | 551 | $2.7 billion |
| 69 | 61 | BlueLinx Holdings |
477 | 15 | - | 724 | $2.1 billion |
| 70 | 78 | Love$amp;#39;s Travel Stops $amp;amp; Country Stores |
470 | - | - | 490 | $26.0 billion |
| 71 | 66 | Oldcastle |
458 | 1,657 | - | 1,444 | - |
| 71 | 72 | Supervalu Inc. |
458 | 10 | - | 1,851 | $17.2 billion |
| 73 | 64 | Perdue Inc. |
449 | 68 | - | 1,432 | - |
| 74 | 61 | Mohawk Industries |
448 | 145 | - | 2,380 | $7.7 billion |
| 75 | 65 | Pepsi Bottling Ventures |
445 | 134 | 302 | 532 | - |
| 76 | 69 | Wakefern Food Corp. |
441 | - | - | 2,200 | - |
| 77 | 74 | Sanderson Farms Inc. |
434 | 16 | - | 592 | $2.7 billion |
| 77 | 79 | Sherwin-Williams Co. |
434 | 1 | - | 1,378 | $10.2 billion |
| 79 | 70 | Shamrock Foods Co. |
433 | 59 | 78 | 659 | - |
| 80 | 71 | Leggett $amp;amp; Platt Inc. |
425 | 100 | - | 1,300 | $3.7 billion |
| 81 | 63 | Bimbo Bakeries USA |
418 | 4,784 | - | 1,565 | - |
| 82 | 75 | Ace Hardware |
411 | 1 | - | 1,355 | - |
| 83 | - | Maines Paper & Food Service |
410 | 60 | - | 525 | - |
| 84 | 75 | Sentinel Transportation |
407 | 51 | - | 969 | - |
| 85 | 79 | The H.T. Hackney Co. |
395 | 161 | - | 469 | - |
| 86 | 84 | J.R. Simplot Co. |
382 | 793 | - | 1,422 | - |
| 87 | 80 | Castellini Co. |
373 | - | - | 530 | - |
| 88 | 80 | Army $amp;amp; Air Force Exchange Service |
369 | 23 | 10 | 1,633 | $10.3 billion |
| 89 | 76 | Gilster-Mary Lee Corp. |
361 | - | - | 1,143 | - |
| 90 | 77 | AmeriGas Partners |
360 | 8,450 | - | 750 | $3.2 billion |
| 90 | 90 | Nexeo Solutions |
360 | 5 | 20 | 750 | $4.0 billion |
| 92 | 87 | McKee Foods Corp. |
345 | - | - | 633 | $1.3 billion |
| 92 | 82 | Silver Eagle Distributors |
345 | 13 | 74 | 325 | - |
| 94 | 88 | Valley Proteins Inc. |
334 | 111 | 20 | 1,025 | - |
| 95 | 85 | Stericycle Inc. |
332 | 1,211 | - | 1,751 | $2.1 billion |
| 96 | 86 | Chrysler Group Transport |
331 | 13 | - | 1,294 | - |
| 97 | 81 | Coca-Cola Bottling Co. Consolidated |
322 | 357 | - | 415 | $1.6 billion |
| 98 | 72 | Mobile Mini Inc. |
320 | 199 | - | 399 | $0.4 billion |
| 99 | 88 | Bridgestone Americas Tire Operations |
305 | 1,163 | - | 1,119 | - |
| 100 | 99 | Beacon Roofing Supply |
305 | 771 | - | 624 | $2.2 billion |
| 100 | 92 | CVS Caremark Corp. |
305 | 8 | - | 806 | $126.8 billion |
The Top 100 Private Carriers on this list operate their own trucks to carry freight and are ranked on the basis of the total number of highway tractors in the fleet. To be included in the Top 100 list, please send contact information to tteditor@ttnews.com. We will contact you via phone or e-mail to get information about your company prior to publication of the next Top 100 list.

On the Bubble

California Eyes Lawsuit to Block Kroger-Albertsons Deal
California is preparing a lawsuit to block Kroger Co.’s $24.6 billion acquisition of Albertsons Cos. on concerns the deal could hurt consumers and workers, Attorney General Rob Bonta said.
PepsiCo Boosts Forecast as Sales Withstand Ozempic Threat
PepsiCo Inc. says appetite-suppressing drugs haven’t affected sales of its snacks and sodas, though the company is focused on package size as it aims to reach its raised annual forecast.
Mercedes Unveils Longhaul Electric Truck
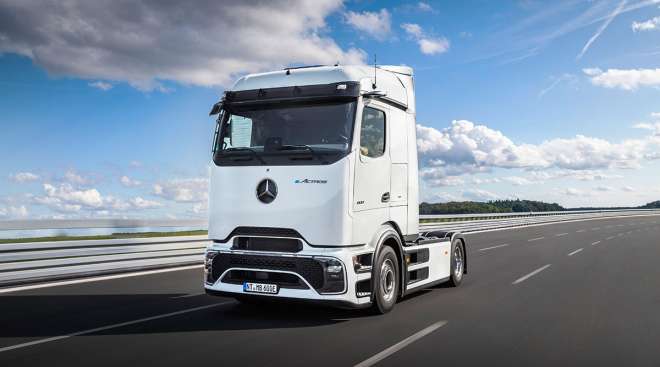
Mercedes-Benz Trucks revealed a heavy-duty electric truck to take on Tesla Inc.’s battery-powered Semi, the latest move in the intensifying race to decarbonize road logistics.
Love’s Buys Legal Aid Specialist TVC Pro-Driver
Love’s Travel Stops bought driver legal aid specialist TVC Pro-Driver for an undisclosed sum on Oct. 4, the truck stop owner said.
Amazon to Open Pair of Facilities in Virginia Beach
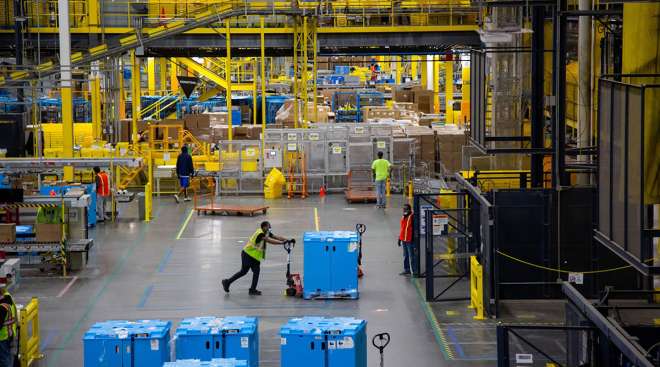
Virginia Gov. Glenn Youngkin has announced Amazon will build a multistory robotics fulfillment center and “last mile” delivery station in Virginia Beach.
Amazon Violated Worker Rights Settlement, NLRB Says
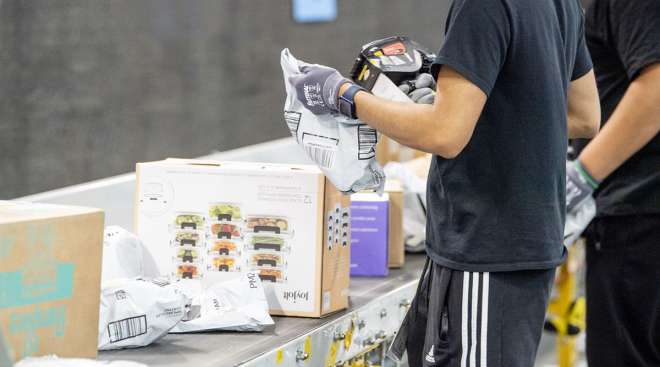
Amazon.com Inc. was accused by U.S. officials of violating a labor board settlement, paving the way for the government to consider claims that the company tried to suppress union organizing.
UPS to Hire 30,000 Extra Drivers for Peak Season
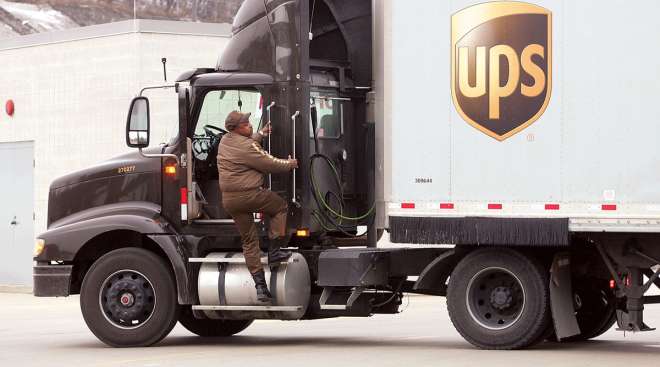
UPS Inc. is set to hire more than 30,000 additional drivers for peak season, a mix of package car drivers, commercial driver license drivers and seasonal support drivers.
FTC Sues Amazon in Landmark Antitrust Case Over Marketplace
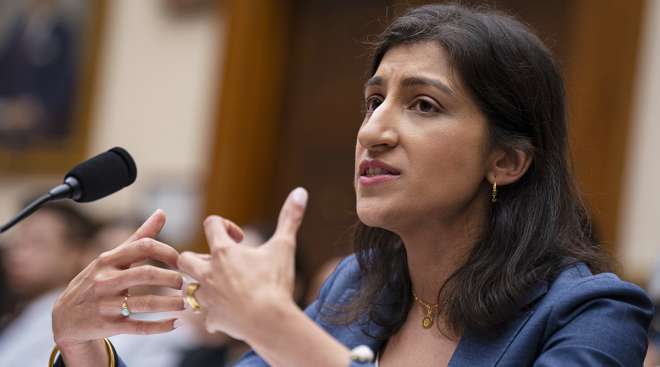
The Federal Trade Commission sued Amazon.com Inc. in a long-anticipated antitrust case, accusing the e-commerce giant of monopolizing online marketplace services.
FTC Poised to Sue Amazon for Antitrust Violations
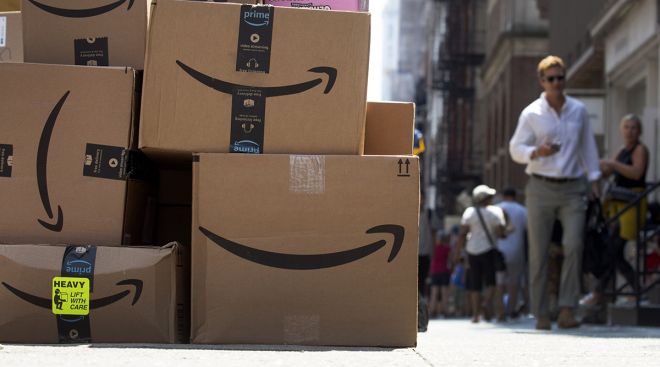
The Federal Trade Commission is expected to sue Amazon for antitrust violations next week, according to people familiar with the matter — the agency’s fourth swipe at the retail giant in 2023.
Uber Freight, Waabi Team Up on AI-Powered Autonomous Trucks
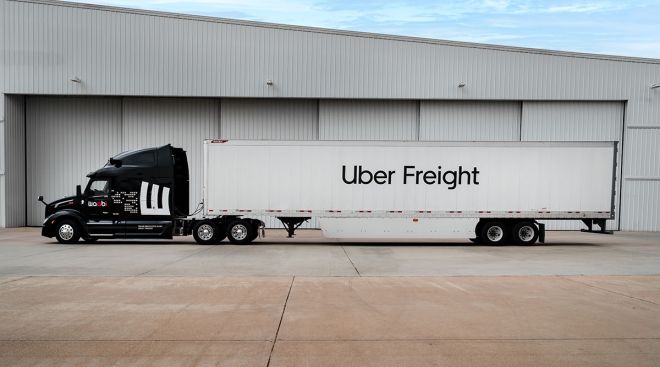
Logistics specialist Uber Freight is teaming up with Waabi Innovation Inc. in an artificial intelligence-powered autonomous truck partnership, the companies said Sept. 21.
-

2023
-
2022
-
2021
-
2020
-
2019
-
2018
-
2017
-
2016
-
2015
-
2014
-
2013
-
2012
-
2011
-
2010
-
2009
-
2008
-
2007
-
2006
-
2005
-
2004