| Rank This Year | Rank Last Year | Company | Tractors | Trucks | Pickups/ Cargo Vans | Trailers | Annual Revenue |
|---|---|---|---|---|---|---|---|
| 1 | 1 | PepsiCo Inc. |
12,132 | 7,745 | 17,761 | 10,548 | $66.0 billion |
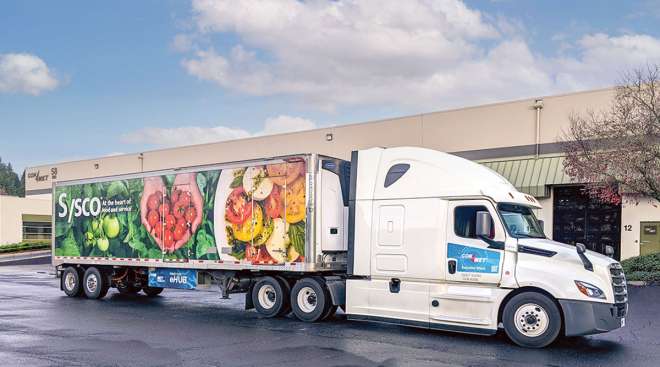
| 2 | 3 | Sysco Corp. |
7,647 | 1,190 | 388 | 9,577 | $44.4 billion |
| 3 | 2 | Coca-Cola Co. |
7,479 | 1,901 | 3,690 | 9,523 | $46.9 billion |
| 4 | 4 | Wal-Mart Stores |
6,239 | - | - | 61,743 | $473.0 billion |
| 5 | 5 | U.S. Foods |
5,438 | 328 | - | 6,472 | $22.0 billion |
| 6 | 5 | Halliburton Co. |
5,025 | 1,009 | - | 8,437 | $29.0 billion |
| 7 | 7 | McLane Co. |
3,650 | 260 | 38 | 4,867 | $44.0 billion |
| 8 | 8 | Agrium Inc. |
3,395 | 2,379 | 6,817 | 4,431 | $11.9 billion |
| 9 | 10 | Reyes Holdings |
3,052 | 510 | 359 | 3,972 | $20.0 billion |
| 10 | 12 | C $amp;amp; J Energy Services/ Nabor Industries |
3,002 | 1,045 | - | 4,048 | $1.1 billion |
| 11 | 9 | Schlumberger Limited |
2,913 | 1,029 | - | 3,741 | $45.0 billion |
| 12 | 11 | Tyson Foods |
2,873 | 3,305 | - | 7,331 | $34.4 billion |
| 13 | 13 | Dr Pepper Snapple Group |
2,388 | 327 | 1,541 | 3,100 | $6.0 billion |
| 14 | 15 | Performance Food Group |
2,349 | 90 | - | 2,899 | - |
| 15 | 13 | Baker Hughes Inc. |
2,285 | 1,817 | - | 2,845 | $22.0 billion |
| 16 | 14 | Dean Foods Co. |
1,888 | 3,183 | 470 | 5,450 | $9.0 billion |
| 17 | 16 | United Rentals Inc. |
1,879 | 2,984 | - | 2,003 | $5.0 billion |
| 18 | 17 | Basic Energy Services |
1,620 | 386 | - | 1,819 | $1.3 billion |
| 19 | 23 | Gibson Energy Inc. |
1,450 | - | - | 2,600 | $3.7 billion |
| 20 | 19 | Weatherford International |
1,428 | 1,106 | - | 3,513 | $15.3 billion |
| 21 | 21 | Airgas Inc. |
1,407 | 3,081 | 946 | 3,872 | $4.9 billion |
| 22 | 24 | Kroger Co. |
1,370 | 35 | - | 4,249 | $98.0 billion |
| 23 | 25 | Clean Harbors Inc. |
1,351 | 3,825 | 2,934 | 5,210 | $3.5 billion |
| 24 | 22 | Gordon Food Service |
1,339 | 136 | - | 1,888 | - |
| 25 | 20 | CHS Inc. |
1,322 | 1,837 | - | 2,060 | $44.0 billion |
| 26 | - | Calfrac Well Services |
1,236 | - | - | 1,443 | $1.6 billion |
| 27 | 30 | Praxair Inc. |
1,200 | 1,500 | - | 2,200 | $11.9 billion |
| 28 | 28 | Prairie Farms Dairy |
1,086 | 1,322 | 242 | 2,907 | - |
| 29 | 29 | Dot Foods |
1,070 | 1 | 12 | 1,650 | - |
| 30 | 27 | Cemex USA |
997 | 4,896 | - | 1,529 | $3.3 billion |
| 31 | - | Veritiv Corp. |
948 | 76 | 124 | 1,352 | $9.5 billion |
| 32 | 32 | Nestle USA |
896 | 3,678 | - | 1,450 | $10.0 billion |
| 33 | 35 | Plains All American Pipeline |
843 | - | - | 1,726 | $42.0 billion |
| 33 | 26 | Safeway Inc. |
843 | 450 | 87 | 3,224 | $36.0 billion |
| 35 | 39 | Air Products Inc. |
830 | 120 | 400 | 2,100 | $10.2 billion |
| 36 | 33 | Ben E. Keith Co. |
825 | - | - | 1,053 | - |
| 37 | 45 | Walgreen Co. |
811 | 5 | - | 1,794 | $72.2 billion |
| 38 | 46 | Helena Chemical Co. |
809 | 1,937 | - | 2,430 | - |
| 39 | 37 | Pilot Flying J Inc. |
808 | 26 | - | 970 | - |
| 40 | 36 | Kellogg Co. |
800 | - | - | 1,200 | $14.8 billion |
| 41 | 48 | Darling Ingredients |
796 | 748 | - | 3,940 | $4.0 billion |
| 42 | 31 | Nuverra Environmental Solutions |
762 | 379 | - | 1,073 | $0.5 billion |
| 43 | 40 | Shaw Industries Group |
754 | 52 | 234 | 3,319 | $4.0 billion |
| 44 | 18 | Key Energy Services |
691 | 1,099 | - | 1,500 | $1.6 billion |
| 45 | 44 | Lowe's Companies Inc. |
683 | 3,802 | - | 712 | $53.4 billion |
| 46 | 42 | Univar USA |
671 | 74 | - | 1,553 | $10.3 billion |
| 47 | 47 | Albertsons |
670 | - | - | 2,500 | - |
| 48 | 38 | JBS USA Holdings |
638 | - | - | 1,504 | - |
| 49 | 50 | Sunbelt Rentals |
628 | 1,132 | - | 657 | $3.0 billion |
| 50 | 49 | Delhaize America |
625 | - | - | 2,095 | $17.1 billion |
| 50 | 51 | Mondelez International |
625 | 315 | - | 760 | $35.3 billion |
| 52 | 41 | Linde North America |
620 | 3,153 | - | 1,913 | - |
| 53 | 56 | United Natural Foods |
604 | 13 | - | 710 | $6.1 billion |
| 54 | 58 | Ashley Furniture Industries |
596 | 7 | - | 1,953 | $3.0 billion |
| 55 | - | Golden State Foods |
594 | 45 | - | 923 | $6.0 billion |
| 56 | 60 | Publix Super Markets |
590 | 16 | 430 | 2,605 | $28.9 billion |
| 57 | 54 | Land O$amp;#39;Lakes Inc. |
580 | 1,134 | 1,001 | 1,530 | $14.2 billion |
| 58 | 57 | Archer Daniels Midland |
561 | 84 | - | 1,510 | $90.0 billion |
| 58 | 55 | Core-Mark Holding Co. |
561 | 70 | - | 693 | $9.8 billion |
| 60 | 62 | ABC Supply Co. |
560 | 2,000 | 88 | 750 | - |
| 61 | 50 | Advanced Drainage Systems |
550 | - | - | 1,100 | - |
| 62 | 43 | MDU Resources Group |
537 | 1,827 | - | 1,905 | $4.5 billion |
| 63 | 68 | American Air Liquide Holdings |
536 | 74 | - | 1,244 | - |
| 64 | 59 | Food Services of America |
511 | 51 | - | 651 | - |
| 65 | 67 | Bunzl Distribution USA |
510 | 24 | 8 | 820 | - |
| 66 | 53 | H.E.B. Grocery Co. |
505 | 9 | - | 2,844 | - |
| 67 | 52 | Foster Farms |
503 | 138 | - | 1,166 | - |
| 68 | 73 | Patterson-UTI Energy Co. |
500 | 506 | - | 551 | $2.7 billion |
| 69 | 61 | BlueLinx Holdings |
477 | 15 | - | 724 | $2.1 billion |
| 70 | 78 | Love$amp;#39;s Travel Stops $amp;amp; Country Stores |
470 | - | - | 490 | $26.0 billion |
| 71 | 66 | Oldcastle |
458 | 1,657 | - | 1,444 | - |
| 71 | 72 | Supervalu Inc. |
458 | 10 | - | 1,851 | $17.2 billion |
| 73 | 64 | Perdue Inc. |
449 | 68 | - | 1,432 | - |
| 74 | 61 | Mohawk Industries |
448 | 145 | - | 2,380 | $7.7 billion |
| 75 | 65 | Pepsi Bottling Ventures |
445 | 134 | 302 | 532 | - |
| 76 | 69 | Wakefern Food Corp. |
441 | - | - | 2,200 | - |
| 77 | 74 | Sanderson Farms Inc. |
434 | 16 | - | 592 | $2.7 billion |
| 77 | 79 | Sherwin-Williams Co. |
434 | 1 | - | 1,378 | $10.2 billion |
| 79 | 70 | Shamrock Foods Co. |
433 | 59 | 78 | 659 | - |
| 80 | 71 | Leggett $amp;amp; Platt Inc. |
425 | 100 | - | 1,300 | $3.7 billion |
| 81 | 63 | Bimbo Bakeries USA |
418 | 4,784 | - | 1,565 | - |
| 82 | 75 | Ace Hardware |
411 | 1 | - | 1,355 | - |
| 83 | - | Maines Paper & Food Service |
410 | 60 | - | 525 | - |
| 84 | 75 | Sentinel Transportation |
407 | 51 | - | 969 | - |
| 85 | 79 | The H.T. Hackney Co. |
395 | 161 | - | 469 | - |
| 86 | 84 | J.R. Simplot Co. |
382 | 793 | - | 1,422 | - |
| 87 | 80 | Castellini Co. |
373 | - | - | 530 | - |
| 88 | 80 | Army $amp;amp; Air Force Exchange Service |
369 | 23 | 10 | 1,633 | $10.3 billion |
| 89 | 76 | Gilster-Mary Lee Corp. |
361 | - | - | 1,143 | - |
| 90 | 77 | AmeriGas Partners |
360 | 8,450 | - | 750 | $3.2 billion |
| 90 | 90 | Nexeo Solutions |
360 | 5 | 20 | 750 | $4.0 billion |
| 92 | 87 | McKee Foods Corp. |
345 | - | - | 633 | $1.3 billion |
| 92 | 82 | Silver Eagle Distributors |
345 | 13 | 74 | 325 | - |
| 94 | 88 | Valley Proteins Inc. |
334 | 111 | 20 | 1,025 | - |
| 95 | 85 | Stericycle Inc. |
332 | 1,211 | - | 1,751 | $2.1 billion |
| 96 | 86 | Chrysler Group Transport |
331 | 13 | - | 1,294 | - |
| 97 | 81 | Coca-Cola Bottling Co. Consolidated |
322 | 357 | - | 415 | $1.6 billion |
| 98 | 72 | Mobile Mini Inc. |
320 | 199 | - | 399 | $0.4 billion |
| 99 | 88 | Bridgestone Americas Tire Operations |
305 | 1,163 | - | 1,119 | - |
| 100 | 99 | Beacon Roofing Supply |
305 | 771 | - | 624 | $2.2 billion |
| 100 | 92 | CVS Caremark Corp. |
305 | 8 | - | 806 | $126.8 billion |
The Top 100 Private Carriers on this list operate their own trucks to carry freight and are ranked on the basis of the total number of highway tractors in the fleet. To be included in the Top 100 list, please send contact information to tteditor@ttnews.com. We will contact you via phone or e-mail to get information about your company prior to publication of the next Top 100 list.
On the Bubble
Walmart Attracts Savings-Minded Shoppers, Posts Strong Q3
Walmart extended its streak of strong quarterly gains heading into the holiday season as its low prices attract shoppers looking for deals in a tough economic environment.
Pepsi on Its Way to Surpassing Coca-Cola’s Value
PepsiCo Inc. is on course to take over as the biggest U.S. beverage company by market value, supplanting rival Coca-Cola Co., according to Wall Street analysts.
Amazon to Expand Grocery Delivery
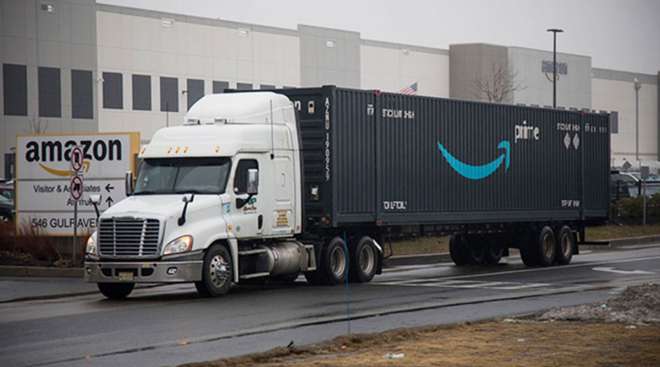
Amazon.com Inc. is rolling out grocery delivery service for non-Prime members to the wider U.S. as it prepares to open more supermarkets next year.
Rivian to End Exclusivity With Amazon
Electric vehicle maker Rivian said Nov. 7 that it will allow other companies to purchase its fleet of delivery vans, ending an exclusive agreement with Amazon.
November 8, 2023ADM Strikes Supply Deal for US Plant-Based Chemical Factory
Archer Daniels Midland Co. has agreed to supply biochemical maker Solugen Inc. with raw materials needed to make plant-based acids at a plant to be built in southwest Minnesota.
Amazon Reports Q3 Revenue Gained 13% to $143.1 Billion
Amazon CEO Andy Jassy gave investors much of what they wanted: robust sales and profit growth along with a hint that the cloud division earnings machine is regaining momentum.
Sysco Breaks Ground on Distribution Facility in Arizona
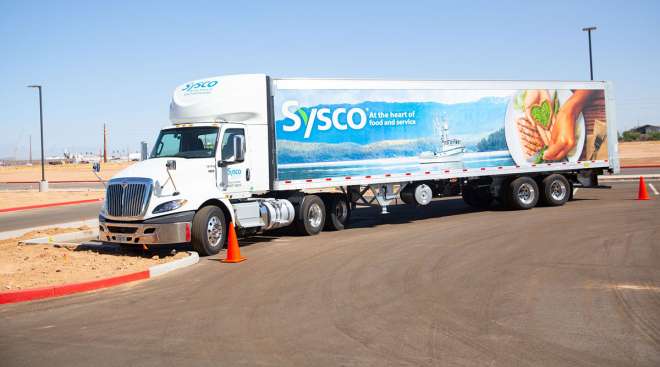
Arizona state and local officials gathered for a groundbreaking ceremony at the site of Sysco Corp.’s future $102 million distribution center in Mesa.
Amazon to Test Prescription Delivery by Drone
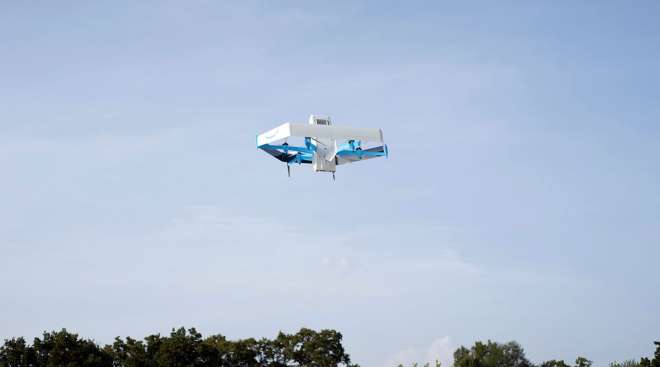
Amazon will soon make prescription drugs fall from the sky when the e-commerce giant becomes the latest company to test drone deliveries for medications.
Sysco to Buy Food Service Distributor Edward Don & Co.
Sysco Corp. is to buy Chicago-based food service equipment and supplies distributor Edward Don & Co. for an undisclosed sum, the S&P 500 member said.
Rite Aid Files for Bankruptcy
PHILADELPHIA — Rite Aid said Oct. 16 that it has filed for bankruptcy and obtained $3.45 billion in fresh financing as it carries out a restructuring plan.
October 16, 2023


