| Rank This Year | Rank Last Year | Company | Tractors | Trucks | Pickups/ Cargo Vans | Trailers | Annual Revenue |
|---|---|---|---|---|---|---|---|
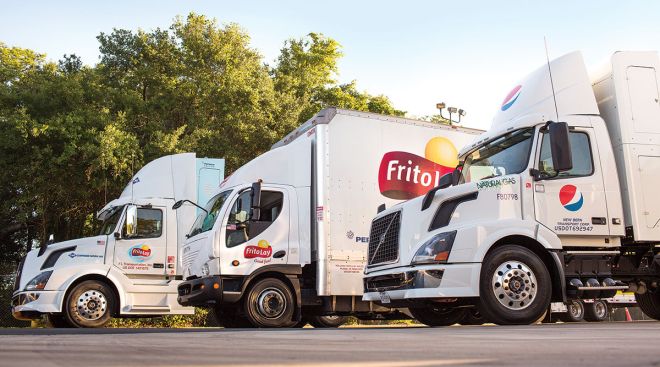
| 1 | 1 | PepsiCo Inc. |
12,132 | 7,745 | 17,761 | 10,548 | $66.0 billion |
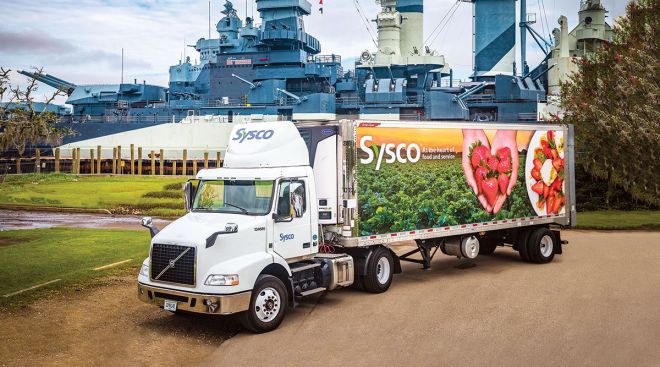
| 2 | 3 | Sysco Corp. |
7,647 | 1,190 | 388 | 9,577 | $44.4 billion |
| 3 | 2 | Coca-Cola Co. |
7,479 | 1,901 | 3,690 | 9,523 | $46.9 billion |
| 4 | 4 | Wal-Mart Stores |
6,239 | - | - | 61,743 | $473.0 billion |
| 5 | 5 | U.S. Foods |
5,438 | 328 | - | 6,472 | $22.0 billion |
| 6 | 5 | Halliburton Co. |
5,025 | 1,009 | - | 8,437 | $29.0 billion |
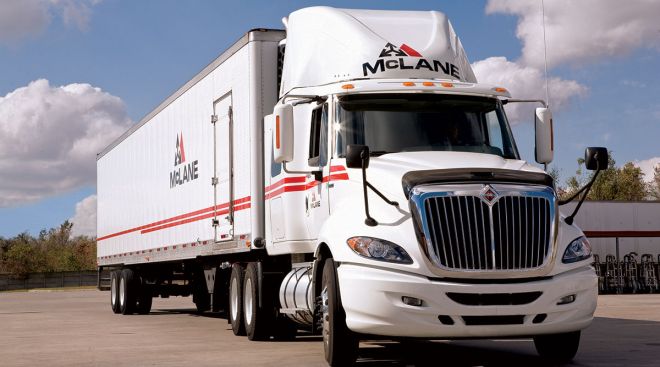
| 7 | 7 | McLane Co. |
3,650 | 260 | 38 | 4,867 | $44.0 billion |
| 8 | 8 | Agrium Inc. |
3,395 | 2,379 | 6,817 | 4,431 | $11.9 billion |
| 9 | 10 | Reyes Holdings |
3,052 | 510 | 359 | 3,972 | $20.0 billion |
| 10 | 12 | C $amp;amp; J Energy Services/ Nabor Industries |
3,002 | 1,045 | - | 4,048 | $1.1 billion |
| 11 | 9 | Schlumberger Limited |
2,913 | 1,029 | - | 3,741 | $45.0 billion |
| 12 | 11 | Tyson Foods |
2,873 | 3,305 | - | 7,331 | $34.4 billion |
| 13 | 13 | Dr Pepper Snapple Group |
2,388 | 327 | 1,541 | 3,100 | $6.0 billion |
| 14 | 15 | Performance Food Group |
2,349 | 90 | - | 2,899 | - |
| 15 | 13 | Baker Hughes Inc. |
2,285 | 1,817 | - | 2,845 | $22.0 billion |
| 16 | 14 | Dean Foods Co. |
1,888 | 3,183 | 470 | 5,450 | $9.0 billion |
| 17 | 16 | United Rentals Inc. |
1,879 | 2,984 | - | 2,003 | $5.0 billion |
| 18 | 17 | Basic Energy Services |
1,620 | 386 | - | 1,819 | $1.3 billion |
| 19 | 23 | Gibson Energy Inc. |
1,450 | - | - | 2,600 | $3.7 billion |
| 20 | 19 | Weatherford International |
1,428 | 1,106 | - | 3,513 | $15.3 billion |
| 21 | 21 | Airgas Inc. |
1,407 | 3,081 | 946 | 3,872 | $4.9 billion |
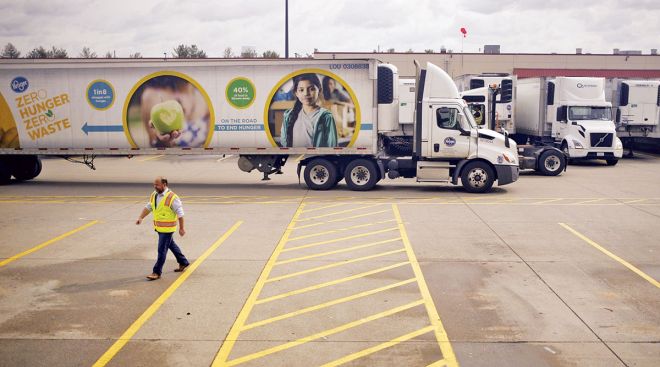
| 22 | 24 | Kroger Co. |
1,370 | 35 | - | 4,249 | $98.0 billion |
| 23 | 25 | Clean Harbors Inc. |
1,351 | 3,825 | 2,934 | 5,210 | $3.5 billion |
| 24 | 22 | Gordon Food Service |
1,339 | 136 | - | 1,888 | - |
| 25 | 20 | CHS Inc. |
1,322 | 1,837 | - | 2,060 | $44.0 billion |
| 26 | - | Calfrac Well Services |
1,236 | - | - | 1,443 | $1.6 billion |
| 27 | 30 | Praxair Inc. |
1,200 | 1,500 | - | 2,200 | $11.9 billion |
| 28 | 28 | Prairie Farms Dairy |
1,086 | 1,322 | 242 | 2,907 | - |
| 29 | 29 | Dot Foods |
1,070 | 1 | 12 | 1,650 | - |
| 30 | 27 | Cemex USA |
997 | 4,896 | - | 1,529 | $3.3 billion |
| 31 | - | Veritiv Corp. |
948 | 76 | 124 | 1,352 | $9.5 billion |
| 32 | 32 | Nestle USA |
896 | 3,678 | - | 1,450 | $10.0 billion |
| 33 | 35 | Plains All American Pipeline |
843 | - | - | 1,726 | $42.0 billion |
| 33 | 26 | Safeway Inc. |
843 | 450 | 87 | 3,224 | $36.0 billion |
| 35 | 39 | Air Products Inc. |
830 | 120 | 400 | 2,100 | $10.2 billion |
| 36 | 33 | Ben E. Keith Co. |
825 | - | - | 1,053 | - |
| 37 | 45 | Walgreen Co. |
811 | 5 | - | 1,794 | $72.2 billion |
| 38 | 46 | Helena Chemical Co. |
809 | 1,937 | - | 2,430 | - |
| 39 | 37 | Pilot Flying J Inc. |
808 | 26 | - | 970 | - |
| 40 | 36 | Kellogg Co. |
800 | - | - | 1,200 | $14.8 billion |
| 41 | 48 | Darling Ingredients |
796 | 748 | - | 3,940 | $4.0 billion |
| 42 | 31 | Nuverra Environmental Solutions |
762 | 379 | - | 1,073 | $0.5 billion |
| 43 | 40 | Shaw Industries Group |
754 | 52 | 234 | 3,319 | $4.0 billion |
| 44 | 18 | Key Energy Services |
691 | 1,099 | - | 1,500 | $1.6 billion |
| 45 | 44 | Lowe's Companies Inc. |
683 | 3,802 | - | 712 | $53.4 billion |
| 46 | 42 | Univar USA |
671 | 74 | - | 1,553 | $10.3 billion |
| 47 | 47 | Albertsons |
670 | - | - | 2,500 | - |
| 48 | 38 | JBS USA Holdings |
638 | - | - | 1,504 | - |
| 49 | 50 | Sunbelt Rentals |
628 | 1,132 | - | 657 | $3.0 billion |
| 50 | 49 | Delhaize America |
625 | - | - | 2,095 | $17.1 billion |
| 50 | 51 | Mondelez International |
625 | 315 | - | 760 | $35.3 billion |
| 52 | 41 | Linde North America |
620 | 3,153 | - | 1,913 | - |
| 53 | 56 | United Natural Foods |
604 | 13 | - | 710 | $6.1 billion |
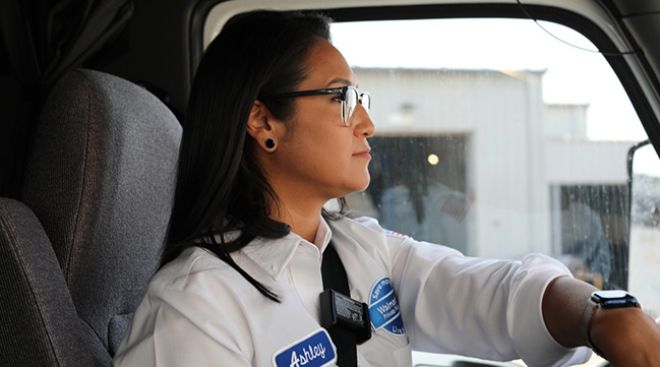
| 54 | 58 | Ashley Furniture Industries |
596 | 7 | - | 1,953 | $3.0 billion |
| 55 | - | Golden State Foods |
594 | 45 | - | 923 | $6.0 billion |
| 56 | 60 | Publix Super Markets |
590 | 16 | 430 | 2,605 | $28.9 billion |
| 57 | 54 | Land O$amp;#39;Lakes Inc. |
580 | 1,134 | 1,001 | 1,530 | $14.2 billion |
| 58 | 57 | Archer Daniels Midland |
561 | 84 | - | 1,510 | $90.0 billion |
| 58 | 55 | Core-Mark Holding Co. |
561 | 70 | - | 693 | $9.8 billion |
| 60 | 62 | ABC Supply Co. |
560 | 2,000 | 88 | 750 | - |
| 61 | 50 | Advanced Drainage Systems |
550 | - | - | 1,100 | - |
| 62 | 43 | MDU Resources Group |
537 | 1,827 | - | 1,905 | $4.5 billion |
| 63 | 68 | American Air Liquide Holdings |
536 | 74 | - | 1,244 | - |
| 64 | 59 | Food Services of America |
511 | 51 | - | 651 | - |
| 65 | 67 | Bunzl Distribution USA |
510 | 24 | 8 | 820 | - |
| 66 | 53 | H.E.B. Grocery Co. |
505 | 9 | - | 2,844 | - |
| 67 | 52 | Foster Farms |
503 | 138 | - | 1,166 | - |
| 68 | 73 | Patterson-UTI Energy Co. |
500 | 506 | - | 551 | $2.7 billion |
| 69 | 61 | BlueLinx Holdings |
477 | 15 | - | 724 | $2.1 billion |
| 70 | 78 | Love$amp;#39;s Travel Stops $amp;amp; Country Stores |
470 | - | - | 490 | $26.0 billion |
| 71 | 66 | Oldcastle |
458 | 1,657 | - | 1,444 | - |
| 71 | 72 | Supervalu Inc. |
458 | 10 | - | 1,851 | $17.2 billion |
| 73 | 64 | Perdue Inc. |
449 | 68 | - | 1,432 | - |
| 74 | 61 | Mohawk Industries |
448 | 145 | - | 2,380 | $7.7 billion |
| 75 | 65 | Pepsi Bottling Ventures |
445 | 134 | 302 | 532 | - |
| 76 | 69 | Wakefern Food Corp. |
441 | - | - | 2,200 | - |
| 77 | 74 | Sanderson Farms Inc. |
434 | 16 | - | 592 | $2.7 billion |
| 77 | 79 | Sherwin-Williams Co. |
434 | 1 | - | 1,378 | $10.2 billion |
| 79 | 70 | Shamrock Foods Co. |
433 | 59 | 78 | 659 | - |
| 80 | 71 | Leggett $amp;amp; Platt Inc. |
425 | 100 | - | 1,300 | $3.7 billion |
| 81 | 63 | Bimbo Bakeries USA |
418 | 4,784 | - | 1,565 | - |
| 82 | 75 | Ace Hardware |
411 | 1 | - | 1,355 | - |
| 83 | - | Maines Paper & Food Service |
410 | 60 | - | 525 | - |
| 84 | 75 | Sentinel Transportation |
407 | 51 | - | 969 | - |
| 85 | 79 | The H.T. Hackney Co. |
395 | 161 | - | 469 | - |
| 86 | 84 | J.R. Simplot Co. |
382 | 793 | - | 1,422 | - |
| 87 | 80 | Castellini Co. |
373 | - | - | 530 | - |
| 88 | 80 | Army $amp;amp; Air Force Exchange Service |
369 | 23 | 10 | 1,633 | $10.3 billion |
| 89 | 76 | Gilster-Mary Lee Corp. |
361 | - | - | 1,143 | - |
| 90 | 77 | AmeriGas Partners |
360 | 8,450 | - | 750 | $3.2 billion |
| 90 | 90 | Nexeo Solutions |
360 | 5 | 20 | 750 | $4.0 billion |
| 92 | 87 | McKee Foods Corp. |
345 | - | - | 633 | $1.3 billion |
| 92 | 82 | Silver Eagle Distributors |
345 | 13 | 74 | 325 | - |
| 94 | 88 | Valley Proteins Inc. |
334 | 111 | 20 | 1,025 | - |
| 95 | 85 | Stericycle Inc. |
332 | 1,211 | - | 1,751 | $2.1 billion |
| 96 | 86 | Chrysler Group Transport |
331 | 13 | - | 1,294 | - |
| 97 | 81 | Coca-Cola Bottling Co. Consolidated |
322 | 357 | - | 415 | $1.6 billion |
| 98 | 72 | Mobile Mini Inc. |
320 | 199 | - | 399 | $0.4 billion |
| 99 | 88 | Bridgestone Americas Tire Operations |
305 | 1,163 | - | 1,119 | - |
| 100 | 99 | Beacon Roofing Supply |
305 | 771 | - | 624 | $2.2 billion |
| 100 | 92 | CVS Caremark Corp. |
305 | 8 | - | 806 | $126.8 billion |
The Top 100 Private Carriers on this list operate their own trucks to carry freight and are ranked on the basis of the total number of highway tractors in the fleet. To be included in the Top 100 list, please send contact information to tteditor@ttnews.com. We will contact you via phone or e-mail to get information about your company prior to publication of the next Top 100 list.

On the Bubble

Sam’s Club to Open Big Distribution Center in Oklahoma City
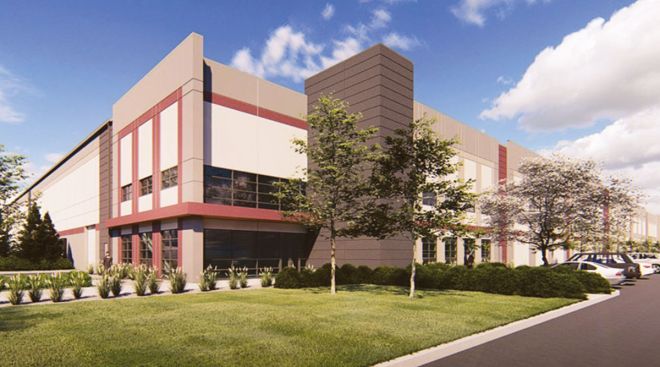
Oklahoma officials applauded news that Sam’s Club will invest $40 million to open a large distribution center in the state scheduled to open early next year.
Instacart Files for IPO Revealing Profit, PepsiCo Investment
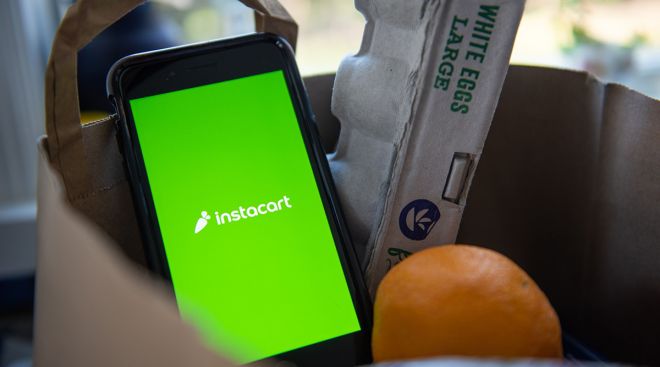
Instacart joined chip designer Arm Holdings Ltd. in moving ahead with an initial public offering, adding momentum to a return of high-profile listings.
August 25, 2023Private Fleet Sector Rankings Illustrate Market Shifts
The biggest private motor carriers across a variety of industries experienced ups and downs during the past year as they adapted to changing freight market conditions.
Ashley's Trucking Fleet Keeps Furniture Moving
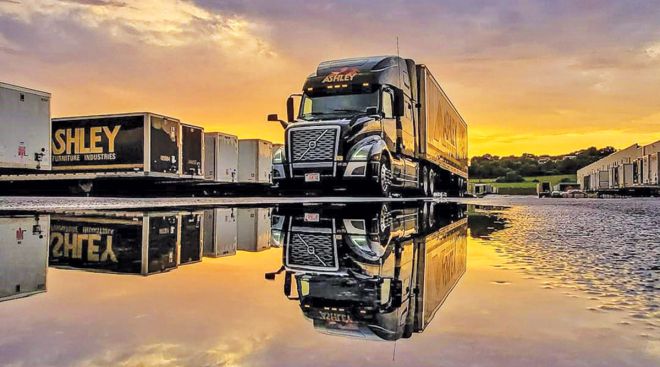
In recent years, Ashley Furniture Industries has been expanding its own private trucking fleet — both organically and through acquisition — to further bolster its supply chain.
Kroger, Albertsons CEOs Give Details on Proposed Merger
Kroger CEO Rodney McMullen and Albertsons CEO Vivek Sankaran made a number of pledges to their customers and employees if their proposed grocery merger prevails.
Private Fleets Continue Optimization Efforts
Private motor carriers, like all trucking operations, have adjusted to shifting freight market conditions in the past year as truck capacity has loosened and freight rates have softened.
Top 100 Private Carriers Adjust to Freight Slowdown
From food service distributors to in-house trucking divisions of retailers, the largest private motor carriers in North America have remained busy even as the freight market has cooled.
Walmart’s First Class of Homegrown Truck Drivers Graduates
Last year Walmart Inc. dangled $110,000 trucking jobs to its own store workers. Now, the first classes of students are graduating.
Walmart, Alphabet to Test Wider Drone Deliveries
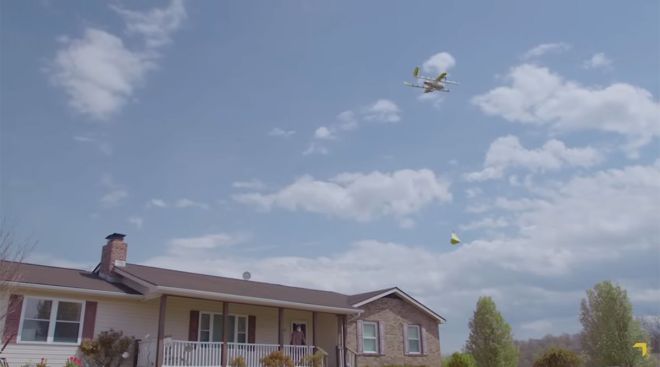
Walmart Inc. is planning its longest drone deliveries yet by teaming up with Alphabet Inc.’s Wing unit at two Dallas-area stores.
Kroger-Albertsons Merger Draws Protest From State Officials
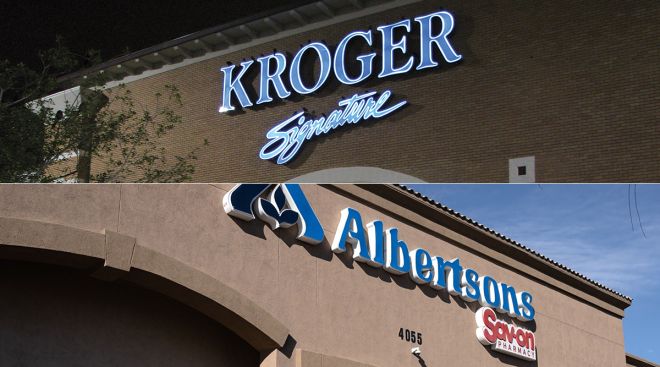
The proposed merger of food retail giants Kroger and Albertsons has elicited criticism from seven secretaries of state.
-

2023
-
2022
-
2021
-
2020
-
2019
-
2018
-
2017
-
2016
-
2015
-
2014
-
2013
-
2012
-
2011
-
2010
-
2009
-
2008
-
2007
-
2006
-
2005
-
2004