| Rank This Year | Rank Last Year | Company | Tractors | Trucks | Pickups/ Cargo Vans | Trailers | Annual Revenue |
|---|---|---|---|---|---|---|---|
| 1 | 1 | PepsiCo Inc. |
12,132 | 7,745 | 17,761 | 10,548 | $66.0 billion |
| 2 | 3 | Sysco Corp. |
7,647 | 1,190 | 388 | 9,577 | $44.4 billion |
| 3 | 2 | Coca-Cola Co. |
7,479 | 1,901 | 3,690 | 9,523 | $46.9 billion |
| 4 | 4 | Wal-Mart Stores |
6,239 | - | - | 61,743 | $473.0 billion |
| 5 | 5 | U.S. Foods |
5,438 | 328 | - | 6,472 | $22.0 billion |
| 6 | 5 | Halliburton Co. |
5,025 | 1,009 | - | 8,437 | $29.0 billion |
| 7 | 7 | McLane Co. |
3,650 | 260 | 38 | 4,867 | $44.0 billion |
| 8 | 8 | Agrium Inc. |
3,395 | 2,379 | 6,817 | 4,431 | $11.9 billion |
| 9 | 10 | Reyes Holdings |
3,052 | 510 | 359 | 3,972 | $20.0 billion |
| 10 | 12 | C $amp;amp; J Energy Services/ Nabor Industries |
3,002 | 1,045 | - | 4,048 | $1.1 billion |
| 11 | 9 | Schlumberger Limited |
2,913 | 1,029 | - | 3,741 | $45.0 billion |
| 12 | 11 | Tyson Foods |
2,873 | 3,305 | - | 7,331 | $34.4 billion |
| 13 | 13 | Dr Pepper Snapple Group |
2,388 | 327 | 1,541 | 3,100 | $6.0 billion |
| 14 | 15 | Performance Food Group |
2,349 | 90 | - | 2,899 | - |
| 15 | 13 | Baker Hughes Inc. |
2,285 | 1,817 | - | 2,845 | $22.0 billion |
| 16 | 14 | Dean Foods Co. |
1,888 | 3,183 | 470 | 5,450 | $9.0 billion |
| 17 | 16 | United Rentals Inc. |
1,879 | 2,984 | - | 2,003 | $5.0 billion |
| 18 | 17 | Basic Energy Services |
1,620 | 386 | - | 1,819 | $1.3 billion |
| 19 | 23 | Gibson Energy Inc. |
1,450 | - | - | 2,600 | $3.7 billion |
| 20 | 19 | Weatherford International |
1,428 | 1,106 | - | 3,513 | $15.3 billion |
| 21 | 21 | Airgas Inc. |
1,407 | 3,081 | 946 | 3,872 | $4.9 billion |
| 22 | 24 | Kroger Co. |
1,370 | 35 | - | 4,249 | $98.0 billion |
| 23 | 25 | Clean Harbors Inc. |
1,351 | 3,825 | 2,934 | 5,210 | $3.5 billion |
| 24 | 22 | Gordon Food Service |
1,339 | 136 | - | 1,888 | - |
| 25 | 20 | CHS Inc. |
1,322 | 1,837 | - | 2,060 | $44.0 billion |
| 26 | - | Calfrac Well Services |
1,236 | - | - | 1,443 | $1.6 billion |
| 27 | 30 | Praxair Inc. |
1,200 | 1,500 | - | 2,200 | $11.9 billion |
| 28 | 28 | Prairie Farms Dairy |
1,086 | 1,322 | 242 | 2,907 | - |
| 29 | 29 | Dot Foods |
1,070 | 1 | 12 | 1,650 | - |
| 30 | 27 | Cemex USA |
997 | 4,896 | - | 1,529 | $3.3 billion |
| 31 | - | Veritiv Corp. |
948 | 76 | 124 | 1,352 | $9.5 billion |
| 32 | 32 | Nestle USA |
896 | 3,678 | - | 1,450 | $10.0 billion |
| 33 | 35 | Plains All American Pipeline |
843 | - | - | 1,726 | $42.0 billion |
| 33 | 26 | Safeway Inc. |
843 | 450 | 87 | 3,224 | $36.0 billion |
| 35 | 39 | Air Products Inc. |
830 | 120 | 400 | 2,100 | $10.2 billion |
| 36 | 33 | Ben E. Keith Co. |
825 | - | - | 1,053 | - |
| 37 | 45 | Walgreen Co. |
811 | 5 | - | 1,794 | $72.2 billion |
| 38 | 46 | Helena Chemical Co. |
809 | 1,937 | - | 2,430 | - |
| 39 | 37 | Pilot Flying J Inc. |
808 | 26 | - | 970 | - |
| 40 | 36 | Kellogg Co. |
800 | - | - | 1,200 | $14.8 billion |
| 41 | 48 | Darling Ingredients |
796 | 748 | - | 3,940 | $4.0 billion |
| 42 | 31 | Nuverra Environmental Solutions |
762 | 379 | - | 1,073 | $0.5 billion |
| 43 | 40 | Shaw Industries Group |
754 | 52 | 234 | 3,319 | $4.0 billion |
| 44 | 18 | Key Energy Services |
691 | 1,099 | - | 1,500 | $1.6 billion |
| 45 | 44 | Lowe's Companies Inc. |
683 | 3,802 | - | 712 | $53.4 billion |
| 46 | 42 | Univar USA |
671 | 74 | - | 1,553 | $10.3 billion |
| 47 | 47 | Albertsons |
670 | - | - | 2,500 | - |
| 48 | 38 | JBS USA Holdings |
638 | - | - | 1,504 | - |
| 49 | 50 | Sunbelt Rentals |
628 | 1,132 | - | 657 | $3.0 billion |
| 50 | 49 | Delhaize America |
625 | - | - | 2,095 | $17.1 billion |
| 50 | 51 | Mondelez International |
625 | 315 | - | 760 | $35.3 billion |
| 52 | 41 | Linde North America |
620 | 3,153 | - | 1,913 | - |
| 53 | 56 | United Natural Foods |
604 | 13 | - | 710 | $6.1 billion |
| 54 | 58 | Ashley Furniture Industries |
596 | 7 | - | 1,953 | $3.0 billion |
| 55 | - | Golden State Foods |
594 | 45 | - | 923 | $6.0 billion |
| 56 | 60 | Publix Super Markets |
590 | 16 | 430 | 2,605 | $28.9 billion |
| 57 | 54 | Land O$amp;#39;Lakes Inc. |
580 | 1,134 | 1,001 | 1,530 | $14.2 billion |
| 58 | 57 | Archer Daniels Midland |
561 | 84 | - | 1,510 | $90.0 billion |
| 58 | 55 | Core-Mark Holding Co. |
561 | 70 | - | 693 | $9.8 billion |
| 60 | 62 | ABC Supply Co. |
560 | 2,000 | 88 | 750 | - |
| 61 | 50 | Advanced Drainage Systems |
550 | - | - | 1,100 | - |
| 62 | 43 | MDU Resources Group |
537 | 1,827 | - | 1,905 | $4.5 billion |
| 63 | 68 | American Air Liquide Holdings |
536 | 74 | - | 1,244 | - |
| 64 | 59 | Food Services of America |
511 | 51 | - | 651 | - |
| 65 | 67 | Bunzl Distribution USA |
510 | 24 | 8 | 820 | - |
| 66 | 53 | H.E.B. Grocery Co. |
505 | 9 | - | 2,844 | - |
| 67 | 52 | Foster Farms |
503 | 138 | - | 1,166 | - |
| 68 | 73 | Patterson-UTI Energy Co. |
500 | 506 | - | 551 | $2.7 billion |
| 69 | 61 | BlueLinx Holdings |
477 | 15 | - | 724 | $2.1 billion |
| 70 | 78 | Love$amp;#39;s Travel Stops $amp;amp; Country Stores |
470 | - | - | 490 | $26.0 billion |
| 71 | 66 | Oldcastle |
458 | 1,657 | - | 1,444 | - |
| 71 | 72 | Supervalu Inc. |
458 | 10 | - | 1,851 | $17.2 billion |
| 73 | 64 | Perdue Inc. |
449 | 68 | - | 1,432 | - |
| 74 | 61 | Mohawk Industries |
448 | 145 | - | 2,380 | $7.7 billion |
| 75 | 65 | Pepsi Bottling Ventures |
445 | 134 | 302 | 532 | - |
| 76 | 69 | Wakefern Food Corp. |
441 | - | - | 2,200 | - |
| 77 | 74 | Sanderson Farms Inc. |
434 | 16 | - | 592 | $2.7 billion |
| 77 | 79 | Sherwin-Williams Co. |
434 | 1 | - | 1,378 | $10.2 billion |
| 79 | 70 | Shamrock Foods Co. |
433 | 59 | 78 | 659 | - |
| 80 | 71 | Leggett $amp;amp; Platt Inc. |
425 | 100 | - | 1,300 | $3.7 billion |
| 81 | 63 | Bimbo Bakeries USA |
418 | 4,784 | - | 1,565 | - |
| 82 | 75 | Ace Hardware |
411 | 1 | - | 1,355 | - |
| 83 | - | Maines Paper & Food Service |
410 | 60 | - | 525 | - |
| 84 | 75 | Sentinel Transportation |
407 | 51 | - | 969 | - |
| 85 | 79 | The H.T. Hackney Co. |
395 | 161 | - | 469 | - |
| 86 | 84 | J.R. Simplot Co. |
382 | 793 | - | 1,422 | - |
| 87 | 80 | Castellini Co. |
373 | - | - | 530 | - |
| 88 | 80 | Army $amp;amp; Air Force Exchange Service |
369 | 23 | 10 | 1,633 | $10.3 billion |
| 89 | 76 | Gilster-Mary Lee Corp. |
361 | - | - | 1,143 | - |
| 90 | 77 | AmeriGas Partners |
360 | 8,450 | - | 750 | $3.2 billion |
| 90 | 90 | Nexeo Solutions |
360 | 5 | 20 | 750 | $4.0 billion |
| 92 | 87 | McKee Foods Corp. |
345 | - | - | 633 | $1.3 billion |
| 92 | 82 | Silver Eagle Distributors |
345 | 13 | 74 | 325 | - |
| 94 | 88 | Valley Proteins Inc. |
334 | 111 | 20 | 1,025 | - |
| 95 | 85 | Stericycle Inc. |
332 | 1,211 | - | 1,751 | $2.1 billion |
| 96 | 86 | Chrysler Group Transport |
331 | 13 | - | 1,294 | - |
| 97 | 81 | Coca-Cola Bottling Co. Consolidated |
322 | 357 | - | 415 | $1.6 billion |
| 98 | 72 | Mobile Mini Inc. |
320 | 199 | - | 399 | $0.4 billion |
| 99 | 88 | Bridgestone Americas Tire Operations |
305 | 1,163 | - | 1,119 | - |
| 100 | 99 | Beacon Roofing Supply |
305 | 771 | - | 624 | $2.2 billion |
| 100 | 92 | CVS Caremark Corp. |
305 | 8 | - | 806 | $126.8 billion |
The Top 100 Private Carriers on this list operate their own trucks to carry freight and are ranked on the basis of the total number of highway tractors in the fleet. To be included in the Top 100 list, please send contact information to tteditor@ttnews.com. We will contact you via phone or e-mail to get information about your company prior to publication of the next Top 100 list.

On the Bubble

Amazon Workers Say They Struggle to Afford Food, Rent

Five years after Amazon.com Inc. raised wages to $15 an hour, half of warehouse workers surveyed by researchers say they struggle to afford enough food or a place to live.
Amazon Chooses Volvo VNR Electric as First Class 8 BET in US

E-commerce giant Amazon.com Inc. plans to deploy 47 Volvo VNR Electric tractors across its Southern California operations, its first Class 8 battery-electric trucks.
Performance Food Group Takes Electric Plunge
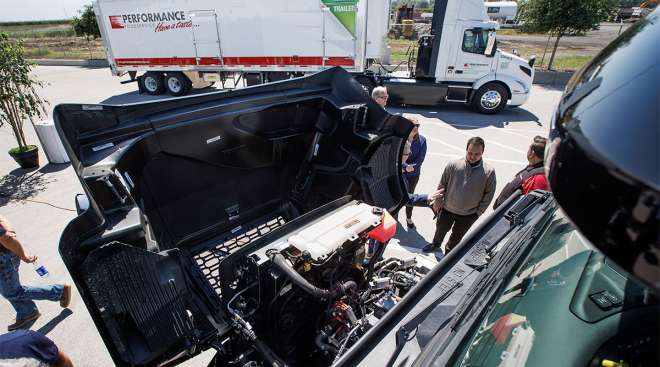
Performance Food Group has seven electric trucks, supported by an array of charging stations, an upcoming installation of solar panels and a fleet of all-electric refrigerated trailers.
Amazon Sees Strong Q1 Results Driven by Cloud-Computing Unit
NEW YORK — Amazon reported strong results for the first quarter, driven by growth in its cloud-computing unit and a new surge of advertising dollars from its Prime Video streaming service.
ADM Shares Fall as CEO Cites Transition From Boom Years
Archer-Daniels-Midland Co.’s shares slumped as the agribusiness giant warned of pressured margins for the remainder of the year, even as quarterly earnings beat estimates.
Air Products Plans Alberta Hydrogen Truck Refueling Network

Air Products plans to build a network of hydrogen refueling stations between Edmonton and Calgary in Alberta for trucks, the industrial gas giant said.
PepsiCo Beats Q1 Revenue Forecasts
PepsiCo reported better-than-expected revenue in the first quarter on strong international demand for its snacks and beverages.
Kroger, Albertsons Agree to Divest More Stores
Kroger Co. and Albertsons Cos. agreed to divest more stores to C&S Wholesale Grocers, seeking to make their planned $24.6 billion merger more appealing to antitrust authorities.
Amazon Prime Memberships in US Gain 8% to New High
Amazon.com Inc.’s Prime subscription service hit a new high of 180 million U.S. shoppers in March, up 8% from a year earlier, according to Consumer Intelligence Research Partners.
Amazon Eyes Record High
Wall Street investors are finally doing what analysts have been recommending all along: buying Amazon.com Inc.
-

2023
-
2022
-
2021
-
2020
-
2019
-
2018
-
2017
-
2016
-
2015
-
2014
-
2013
-
2012
-
2011
-
2010
-
2009
-
2008
-
2007
-
2006
-
2005
-
2004