| Rank This Year | Rank Last Year | Company | Revenue (000) | Net Income (000) | Employees | Tractors* | Trailers |
|---|---|---|---|---|---|---|---|
| 1 | 1 | UPS Inc.
|
60,906,000 | 3,431,000 | 434,000 | ||
| 2 | 2 | FedEx Corp.
|
57,570,000 | 1,907,000 | 400,000 | 29,733 | 108,041 |
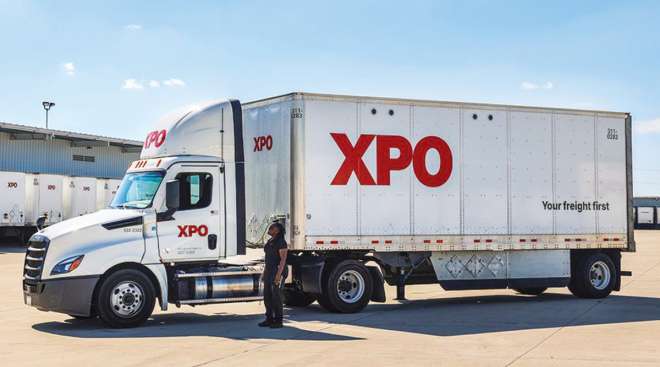
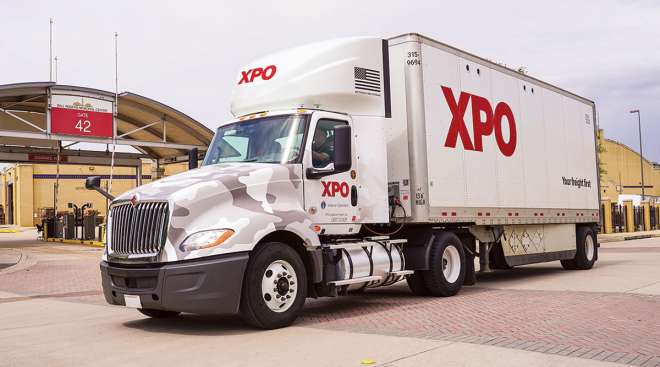
| 3 | 3 | XPO
|
14,619,400 | 63,100 | 89,000 | 15,396 | 27,606 |
| 4 | 4 | J.B. Hunt Transport Services
|
6,555,459 | 432,090 | 22,172 | 14,805 | 30,330 |
| 5 | 5 | Yellow Corp.
|
4,697,500 | 21,500 | 32,000 | 14,300 | 44,500 |
| 6 | 7 | Schneider
|
4,045,736 | 156,851 | 19,300 | 10,459 | 37,910 |
| 7 | 6 | Swift Transportation
|
4,031,517 | 149,267 | 21,900 | 18,366 | 64,066 |
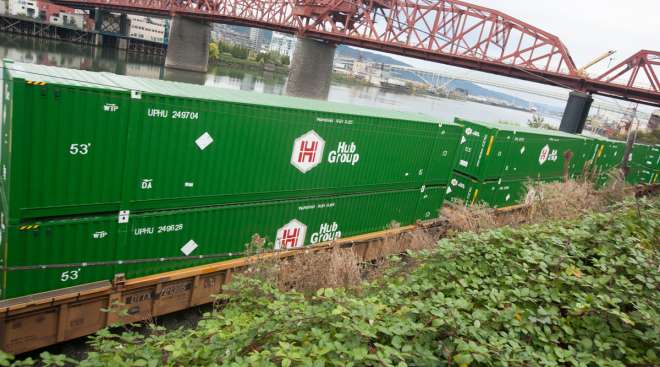
| 8 | 8 | Hub Group
|
3,572,790 | 74,805 | 2,755 | 2,705 | 436 |
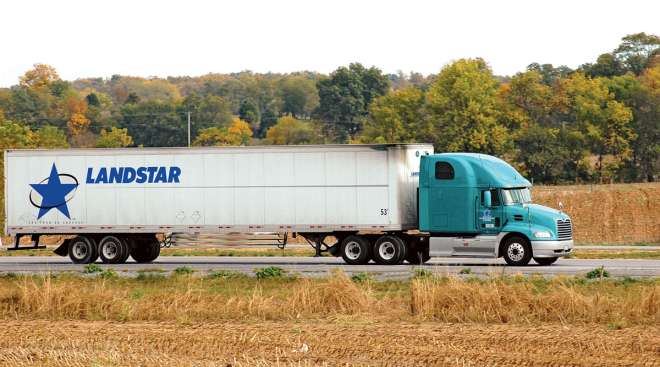
| 9 | 9 | Landstar System
|
3,167,634 | 137,350 | 1,197 | 9,186 | 15,170 |
| 10 | 10 | TFI International
|
3,037,205 | 482,592 | 17,685 | 18,535 | 25,310 |
| 11 | 11 | Old Dominion Freight Line
|
2,991,517 | 295,765 | 19,040 | 7,994 | 32,525 |
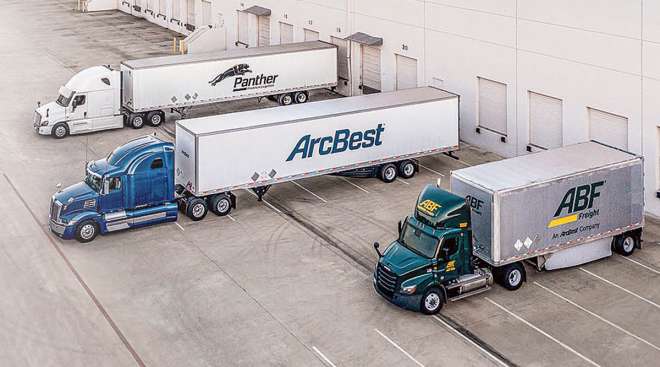
| 12 | 12 | ArcBest
|
2,700,219 | 18,652 | 13,000 | 4,387 | 21,361 |
| 13 | 13 | Ryder System
|
2,658,745 | 169,172 | 67,900 | 42,800 | |
| 14 | 14 | Estes Express Lines
|
2,400,000 | - | 16,570 | 7,009 | 26,718 |
| 15 | 16 | Roadrunner Freight
|
2,044,000 | - | 4,645 | 4,332 | 6,508 |
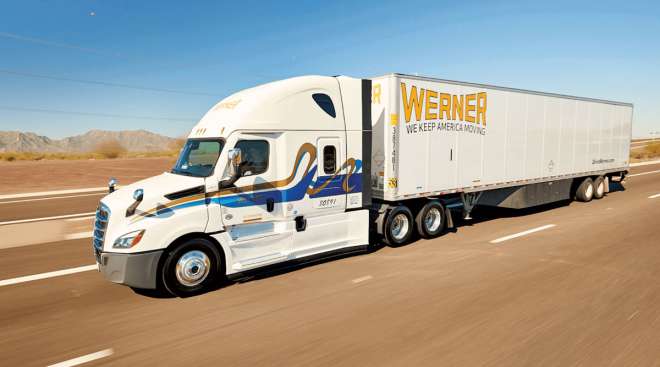
| 16 | 15 | Werner Enterprises
|
2,008,991 | 79,129 | 11,738 | 7,100 | 24,350 |
| 17 | 17 | UniGroup
|
1,700,000 | - | |||
| 18 | 18 | Prime Inc.
|
1,683,834 | 194,247 | 3,661 | 6,246 | 12,309 |
| 19 | 24 | CRST The Transportation Solution
|
1,546,000 | - | 7,849 | 6,682 | 13,811 |
| 20 | 26 | Purolator
|
1,526,207 | - | 10,000 | 463 | 1,280 |
| 21 | 23 | Penske Logistics
|
1,500,000 | - | 14,180 | 2,704 | 8,785 |
| 21 | 20 | Sirva
|
1,400,000 | - | |||
| 21 | 19 | U.S. Xpress Enterprises
|
1,500,000 | - | 10,135 | 7,000 | 15,500 |
| 24 | R+L Carriers
|
1,452,000 | - | 10,000 | 5,958 | 12,604 | |
| 25 | 21 | Kenan Advantage Group
|
1,421,975 | - | 7,561 | 6,869 | 10,404 |
| 26 | 23 | C.R. England
|
1,304,898 | - | 7,883 | 4,165 | 5,990 |
| 27 | 27 | NFI
|
1,250,000 | - | 8,300 | 2,793 | 8,300 |
| 28 | 25 | Saia Inc.
|
1,218,481 | 48,024 | 9,000 | 4,000 | 13,000 |
| 29 | 28 | Southeastern Freight Lines
|
1,192,296 | - | 8,458 | 3,734 | 11,943 |
| 30 | 29 | Knight-Swift Transportation Holdings
|
1,118,034 | 93,863 | 5,500 | 4,705 | 9,915 |
| 31 | 32 | Averitt Express
|
1,091,475 | - | 4,500 | 14,623 | |
| 32 | 30 | Universal Logistics Holdings
|
1,072,751 | 24,244 | 6,275 | 3,801 | 4,154 |
| 33 | 32 | Celadon Group Inc.
|
1,050,000 | 2,700 | 6,000 | 7,050 | 15,000 |
| 34 | 37 | Anderson Trucking Service
|
1,032,144 | - | 1,410 | 2,372 | 6,300 |
| 35 | 33 | Crete Carrier Corp.
|
1,030,000 | - | 5,500 | 5,130 | 12,883 |
| 36 | Cardinal Logistics
|
1,000,600 | - | 4,642 | 3,020 | 9,725 | |
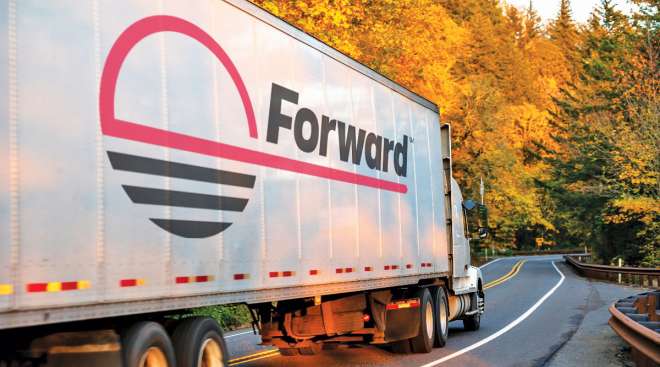
| 37 | 35 | Forward Air
|
982,530 | 27,670 | 3,689 | 935 | 4,868 |
| 38 | 36 | KLLM Transport Services
|
937,000 | - | 3,815 | 5,300 | |
| 39 | 34 | Lynden
|
925,000 | - | 2,800 | 768 | 2,889 |
| 40 | 38 | Ruan
|
872,184 | - | 5,546 | 3,425 | 8,165 |
| 41 | 39 | Atlas World Group
|
795,239 | - | 2,159 | ||
| 42 | 46 | Daseke Inc. (TFI)
|
770,000 | -8,700 | 3,400 | 3,500 | 7,300 |
| 43 | 42 | Quality Carriers
|
758,000 | - | |||
| 44 | 113 | Central Transport International
|
703,000 | - | 3,180 | 6,543 | |
| 45 | 42 | Trimac Transportation
|
700,000 | - | 3,400 | 1,800 | 2,400 |
| 46 | 47 | Marten Transport
|
671,144 | 33,464 | 3,622 | 2,848 | 4,854 |
| 47 | 43 | Covenant Logistics Group
|
670,651 | 16,835 | 4,400 | 2,535 | 7,389 |
| 48 | 44 | Jack Cooper Holdings
|
667,849 | - | 2,119 | 2,126 | |
| 49 | 46 | Stevens Transport
|
662,450 | 77,990 | 2,703 | 2,690 | 3,795 |
| 50 | 52 | Pitt Ohio
|
649,972 | - | 3,178 | 866 | 2,072 |
| 51 | 45 | Day & Ross
|
640,515 | - | 1,829 | 1,531 | 4,010 |
| 52 | 41 | Heartland Express
|
612,937 | 56,386 | 3,600 | 5,049 | 15,218 |
| 53 | 54 | AAA Cooper Transportation
|
605,538 | - | 4,600 | 2,400 | 6,000 |
| 54 | 49 | Suddath
|
550,000 | - | |||
| 55 | 52 | Western Express
|
527,909 | 38,334 | 3,000 | 2,582 | 7,366 |
| 56 | 54 | United Road Services
|
525,000 | - | 1,700 | 1,835 | 1,200 |
| 56 | OnTrac Inc.
|
525,000 | - | 3,000 | 55 | 571 | |
| 58 | 51 | Mullen Group
|
520,272 | - | 3,267 | 1,821 | 4,998 |
| 59 | 59 | Evans Delivery
|
505,000 | - | 320 | 3,865 | 650 |
| 60 | 58 | Dayton Freight Lines
|
498,370 | - | 4,010 | 1,387 | 3,664 |
| 61 | 58 | PS Logistics
|
495,300 | - | 2,600 | 2,247 | 2,359 |
| 62 | 57 | Canada Cartage
|
452,728 | - | 3,110 | 2,429 | 2,736 |
| 63 | 55 | Mercer Transportation
|
449,337 | - | 295 | 2,228 | 2,400 |
| 64 | 69 | Dart Transit Co.
|
441,845 | - | 1,273 | 2,187 | 6,963 |
| 65 | 63 | California Cartage Co.
|
440,000 | - | 1,500 | ||
| 66 | 60 | Shevell Group
|
436,000 | - | 3,895 | 1,550 | 3,902 |
| 67 | 62 | Cowan Systems
|
434,018 | - | 1,915 | 2,059 | 5,111 |
| 68 | 66 | P.A.M. Transport
|
432,852 | 11,101 | 2,463 | 5,699 | |
| 69 | 68 | Bennett Family of Cos.
|
429,616 | - | 998 | 1,338 | 1,892 |
| 70 | 53 | USA Truck
|
429,099 | -7,699 | 2,000 | 1,415 | 5,605 |
| 71 | 61 | TransX Group of Companies
|
423,678 | - | 2,617 | 1,560 | 4,410 |
| 72 | 66 | Mesilla Valley Transportation
|
402,940 | - | 1,900 | 1,400 | 5,100 |
| 73 | TMC Transportation
|
394,000 | - | ||||
| 74 | 65 | Bison Transport
|
432,084 | - | 2,559 | 1,439 | 4,475 |
| 75 | 70 | Interstate Distributor Co.
|
370,168 | - | 2,000 | 1,805 | 3,900 |
| 76 | 70 | Roehl Transport
|
355,323 | - | 2,485 | 1,995 | 4,898 |
| 77 | 96 | Central Freight Lines
|
347,800 | - | 1,127 | 7,852 | |
| 78 | 79 | A. Duie Pyle
|
346,000 | - | 2,800 | 945 | 2,225 |
| 79 | 78 | Black Horse Carriers
|
337,500 | - | 2,625 | 1,520 | 3,000 |
| 80 | 74 | Maverick USA
|
334,953 | - | 2,119 | 1,675 | 2,453 |
| 81 | 71 | Epes Carriers Inc.
|
332,073 | 24,333 | 1,535 | 1,202 | |
| 82 | 75 | Dicom Transportation Group
|
320,700 | - | |||
| 83 | 74 | Cassens Transport
|
317,557 | - | 1,419 | 1,364 | 1,364 |
| 84 | 80 | IMC Logistics
|
293,000 | - | 1,875 | 1,515 | 91 |
| 85 | 76 | Koch Cos.
|
280,000 | - | 1,150 | 1,001 | 5,250 |
| 86 | Dependable Supply Chain Services
|
278,000 | - | 321 | 1,220 | ||
| 87 | 91 | Transport Investments
|
276,000 | - | 200 | 1,150 | 2,100 |
| 88 | TransAm Trucking
|
270,000 | - | 1,144 | 1,818 | ||
| 89 | 82 | Challenger Motor Freight
|
258,006 | - | |||
| 90 | 83 | Trans-System
|
252,500 | - | 1,100 | 1,021 | 1,600 |
| 91 | 84 | Foodliner/Quest Liner
|
252,275 | - | 1,261 | 1,173 | 2,185 |
| 92 | Hirschbach Motor Lines
|
251,697 | - | 646 | 1,010 | ||
| 93 | United Vision Logistics
|
245,000 | - | 1,003 | 1,347 | ||
| 94 | Salmon Cos.
|
241,796 | - | 713 | 1,092 | ||
| 95 | 79 | Comcar Industries
|
240,054 | - | 1,592 | 4,660 | |
| 96 | 86 | John Christner Trucking
|
239,015 | 14,998 | 232 | 844 | 1,060 |
| 97 | 89 | Martin Transportation Systems
|
237,500 | - | 1,637 | 1,130 | 2,200 |
| 98 | 81 | Paschall Truck Lines
|
237,311 | - | 1,872 | 1,303 | 3,101 |
| 99 | 87 | Superior Bulk Logistics
|
233,900 | 5,200 | 1,392 | 1,300 | 2,100 |
| 100 | 94 | Quantix Supply Chain Solutions
|
229,258 | - | 1,100 | 900 | 1,200 |
Top For-Hire Carriers on this list are common and contract freight carriers operating in the United States, Canada and Mexico. Companies are ranked on the basis of annual revenue. To be included in the Top 100 or any of the sectors, please send contact information to tteditor@ttnews.com. We will contact you via phone or e-mail to get information about your company prior to publication of the next Top 100 list.
* Tractor count includes company-owned, lease-to-own and owner-operator tractors.
On the Bubble
Mike Gannon Appointed to Lead CRST
CRST has appointed Mike Gannon as its newest president and CEO, the company announced Aug. 23.
August 23, 2024XPO Explores Sale of European Transportation Business
XPO has revived a sale of its European transportation business, according to people familiar with the matter, almost two years since it last scrapped the attempt to divest the operation.
Trucking Insurance Concerns Go Beyond High Premiums
Although high premiums have been a top concern, industry leaders and state regulators have taken action to curb other insurance challenges that greatly affect the industry at large.
August 9, 2024Forward Air Posts Q2 Loss, but Revenue Soars on Acquisition
Despite the reported net loss, investors appeared to be responding positively. It was primarily due to a one-time goodwill impairment charge related to the Omni acquisition.
ArcBest Q2 Profit Climbs on LTL Margin, Price Increase
Profit at ArcBest rose 16.1% year over year in the second quarter as an improvement in less-than-truckload revenue per shipment and an increase in prices trumped a decline in shipments.
Hub Group Misses Analyst Expectations on Weak Q2 Market
Hub Group profit in the second quarter of 2024 fell due to the ongoing weakness in the North American freight market, but a final-mile acquisition in December 2023 offered a bright spot.
Schneider Q2 Profit Slumps as Intermodal, Logistics Revenue Falls
Schneider National profit in the second quarter of 2024 slumped 54% as price increases failed to arrive as early as the carrier expected and ongoing freight market weakness saw intermodal and logistics revenue decline.
XPO Q2 Profit Jumps as LTL Shipments Rise 4.5%
XPO profit jumped in the second quarter as revenue increased 8% on the back of a 4.5% increase in North American LTL shipments and 7.4% rise in the return obtained for those shipments.
Landstar Q2 Profits Dip Amid Dry Van Market Softness
Profit and revenue at Landstar System Inc. fell in the second quarter of 2024, largely on the back of truckload market weakness.
Werner Spots Signs of Hope Despite Disappointing Q2
Profit dropped at Werner Enterprises Inc. in the second quarter of 2024 as revenue slid more than analysts expected on the back of continued freight weakness, although executives are seeing more room for optimism from the last few weeks.


