Supply chain disruptions may be easing, but freight volumes continue to stir anxiety in shippers.

Non-asset based companies join the field in this year’s Global Freight Top 50 list.

Get a continent-by-continent and country-by-country look at where the Top 50 Global Freight Companies are based.
Rankings
Port Data
| Rank | Port Name | City | Type of Freight | TEUs 2021 | TEUs 2020 | % Change | Freight Tonnage (metric tons) |
|---|---|---|---|---|---|---|---|
| 1 | Port of Los Angeles * | Los Angeles | container, break bulk, dry bulk, liquid bulk, automotive, heavy lift, special project cargo, refrigerated, passenger | 10,677,610 | 9,213,396 | 15.9% | 222,000,000 |
| 2 | Port of Long Beach | Long Beach, Calif. | container, break bulk, dry bulk, liquid bulk, automotive, heavy lift, special project cargo, refrigerated, passenger | 9,384,368 | 8,113,315 | 15.7% | 196,386,014 |
| 3 | Port of New York and New Jersey ^ | New York | container, break bulk, dry bulk, liquid bulk, automotive, heavy lift, special project cargo, refrigerated, passenger | 8,985,929 | 7,585,819 | 18.5% | 112,216,428 |
| 4 | Port of Savannah ^ | Savannah, Ga. | container, break bulk, heavy lift, automobile, refrigerated | 5,613,163 | 4,682,249 | 19.9% | 39,419,938 |
| 5 | Ports of Colon, Cristobal and Manzanillo ** | Colón, Panama | container, liquid bulk, dry bulk, passenger, transshipping | 4,915,975 | 4,454,902 | 10.3% | |
| 6 | Northwest Seaport Alliance | Seattle and Tacoma, Wash. | container, break bulk, liquid bulk, dry bulk, automobile, heavy lift, special project cargo, refrigerated, passenger, air cargo | 3,736,206 | 3,320,379 | 12.5% | 27,363,475 |
| 7 | Port of Vancouver | Vancouver, British Columbia | container, break bulk, dry bulk, liquid bulk, automobile, special project cargo, passenger | 3,678,952 | 3,467,521 | 6.1% | |
| 8 | Port of Balboa/PSA Panama International Terminal | Panama Int'l Terminals, Panama | container, transshipping | 3,561,432 | 3,161,658 | 12.6% | |
| 9 | Port of Virginia | Norfolk, Va. | container, break bulk, dry bulk, liquid bulk, automobile | 3,522,834 | 2,813,415 | 25.2% | 55,797,100 |
| 10 | Port Houston | Houston | container, break bulk, dry bulk, liquid bulk | 3,453,226 | 3,001,164 | 15.1% | 40,399,937 |
| 11 | Port of Manzanillo | Manzanillo, Colima, Mexico | container, dry bulk, liquid bulk | 3,371,438 | 2,909,632 | 15.9% | 35,024,782 |
| 12 | Port of Charleston ^ | Charleston, S.C. | container, break bulk, dry bulk, automobile, refrigerated | 2,751,442 | 2,309,995 | 19.1% | 22,631,975 |
| 13 | Port of Oakland ^ | Oakland, Calif. | container | 2,448,243 | 2,461,262 | -0.5% | 17,635,455 |
| 14 | Port of Kingston | Kingston, Jamaica | container, heavy lift, liquid bulk | 1,975,401 | 1,611,637 | 22.6% | |
| 15 | Port of Montreal | Montreal | container, break bulk, dry bulk, liquid bulk, passenger | 1,728,114 | 1,600,000 | 8.0% | 34,023,135 |
| 16 | Port of Lázaro Cárdenas | Lázaro Cárdenas, Michoacán, Mexico | container, break bulk, dry bulk, liquid bulk | 1,686,076 | 1,063,675 | 58.5% | |
| 17 | Port of Freeport | Freeport, Bahamas | container, passenger | 1,642,780 | 1,231,703 | 33.4% | |
| 18 | Port of San Juan ^ | San Juan, Puerto Rico | container | 1,438,738 | 1,490,218 | -3.5% | 8,470,533 |
| 19 | Port of Jacksonville *** | Jacksonville, Fla. | container, break bulk, dry bulk, liquid bulk, automobile, heavy lift, refrigerated | 1,407,310 | 1,277,161 | 10.2% | 9,378,906 |
| 20 | Moín Container Terminal | Límon, Costa Rica | container | 1,319,372 | 1,213,431 | 8.7% | |
| 21 | Port Miami *** | Miami | container, passenger | 1,254,062 | 1,066,738 | 17.6% | 10,114,409 |
| 22 | Port of Veracruz | Veracruz, Veracruz, Mexico | container, dry bulk, liquid bulk, automobile | 1,165,043 | 1,005,936 | 15.8% | |
| 23 | Port of Prince Rupert | Prince Rupert, British Columbia | container, break bulk, dry bulk, liquid bulk, special project cargo, passenger | 1,054,836 | 1,141,390 | -7.6% | 25,071,050 |
| 24 | Port Everglades *** | Broward County, Fla. | container, break bulk, dry bulk, liquid bulk, passenger | 1,038,179 | 945,512 | 9.8% | 21,346,991 |
| 25 | Port of Baltimore ^ | Baltimore | container, break bulk, dry bulk, liquid bulk, automobile, refrigerated, passenger | 1,022,683 | 1,051,840 | -2.8% | 31,934,742 |
| NOTE: Data for the ports of Manzanillo (Mexico), Kingston, Lázaro Cárdenas, Freeport, San Juan, Moín Container Terminal and Veracruz are from the United Nations Economic Commission for Latin America and the Carribbean. Data for the ports of Balboa, PSA Panama International Terminal, Cristobal, Colon Container Terminal and Manzanillo International Terminal are from the Georgia Tech Panama Logistics Innovation and Research Center. All other data is from respective port authorities. * Tonnage data for the Port of Los Angeles is from its fiscal year ending June 30, 2021. ** Includes data regarding the Panamanian ports of Cristobal, Colon Container Terminal and Manzanillo International Terminal; not to be confused with the Port of Manzanillo in Colima, Mexico. *** TEU and tonnage data for the Port of Jacksonville, Port Miami and Port Everglades is from their fiscal year ending Sept. 30, 2021. ^ Tonnage data for the ports of New York and New Jersey, Savannah, Charleston, Oakland, San Juan and Baltimore are from calendar year 2020, sourced from the United States Army Corp of Engineers. All other tonnage data is from calendar year 2021. |
|||||||


Last year saw air- and sea-freight volumes bounce back from supply chain struggles.

If your company appears in the 2022 list, you have a few ways to announce it. Visit our logo library to get web- and print-ready graphics.

Learn more about Transport Topics’ Top 50 Global Freight Companies publication.
US Trucking Faces Downstream Effects From Suez Canal Attacks

A militant group that is attacking container vessels along the Suez Canal in Egypt is causing shipment disruptions that threaten to inflict downstream effects on the U.S. trucking sector.
January 9, 2024Shipping Shows Signs of Panic as Houthis Menace Trade Lane
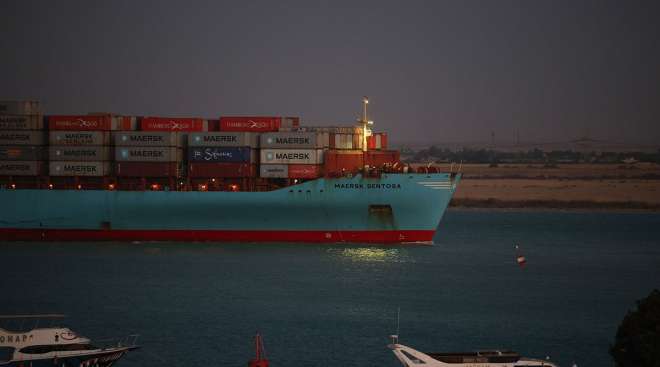
Container shipping is set to face a crunch ahead of the Lunar New Year holiday as Houthi attacks in the Red Sea restrict capacity, a major industry consultant said.
January 8, 2024Maersk Extends Red Sea Diversion and Warns Risk Will Persist

A.P. Moller-Maersk A/S plans to continue diverting ships away from the Red Sea “for the foreseeable future” after pausing transits earlier this week to assess the situation.
January 5, 2024Amazon Captured 29% of Online Orders Before Christmas

Amazon's share of online orders spiked in the final days of the holiday season, showing how big investments in delivery speed paid off as shoppers sought out products they could get quickly.
January 5, 2024Spot Container Shipping Rates Soar 173% on Red Sea Threats
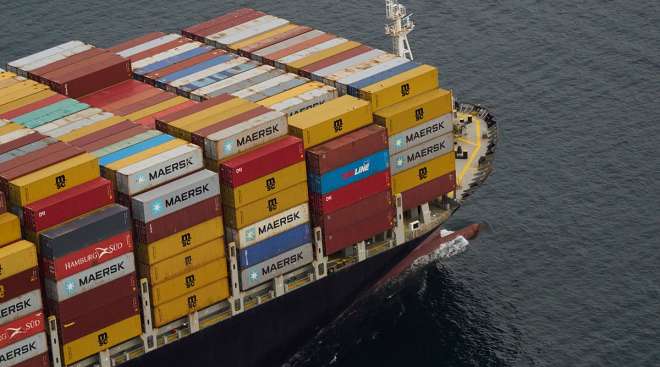
Short-term rates for container shipping between Asia, Europe and the U.S. are climbing on reduced capacity caused by the threats to cargo vessels in the Red Sea.
January 4, 2024Daimler Partners With Amazon for Fuel Cell Truck Trials
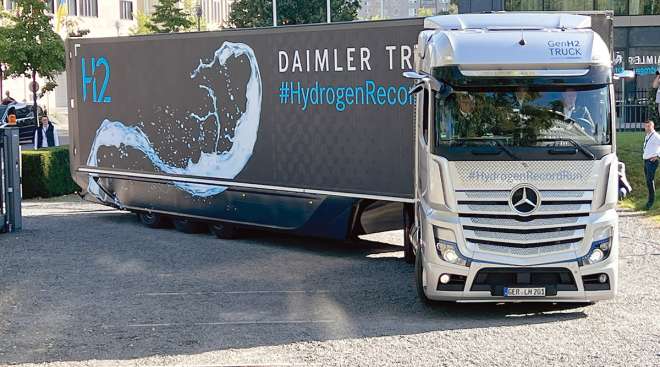
Daimler Truck plans to begin the first on-road customer tests of hydrogen fuel cell-powered Mercedes-Benz GenH2 trucks in global markets in the middle of 2024.
December 20, 2023Red Sea Chaos Has Shippers Bracing for Weeks Without Route
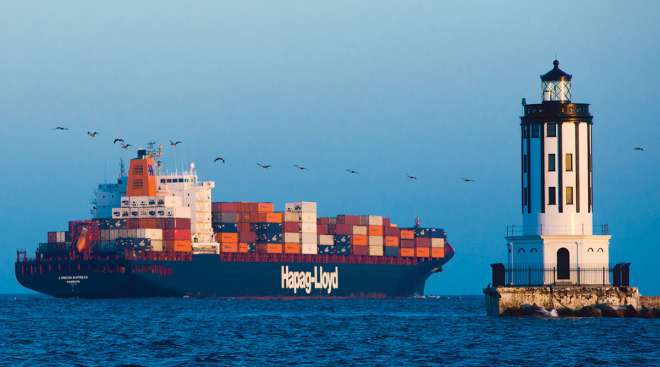
The global shipping industry is bracing for the prospect of living without its most important trade route for weeks.
December 19, 2023Maersk Sails South of Africa to Avoid Red Sea Conflict Area
Shipping giant A.P. Moller-Maersk A/S will redirect its vessels to sail south of Africa to avoid the Red Sea conflict area where Houthi militants have attacked several ships.
December 19, 2023Deutsche Bahn to Sell Logistics Unit Schenker

BERLIN — Germany’s main national railway operator, Deutsche Bahn, on Dec. 19 launched an effort to sell its logistics unit, DB Schenker, as the company concentrates on its core business.
December 19, 2023Railroads Urge Border Officials to Reopen US-Mexico Crossings

Railroads are calling for U.S. Customs and Border Protection to reopen U.S.-Mexico rail crossings at El Paso and Eagle Pass, Texas.
December 18, 2023-

2023
-
2022
-
2021
-
2020
-
2019
-
2018
-
2017
-
2016
-
2015