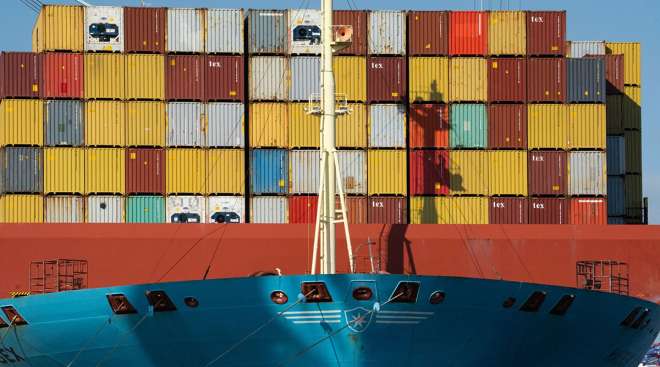
Supply chain disruptions may be easing, but freight volumes continue to stir anxiety in shippers.

Non-asset based companies join the field in this year’s Global Freight Top 50 list.

Get a continent-by-continent and country-by-country look at where the Top 50 Global Freight Companies are based.
Rankings
Port Data
| Rank | Port Name | City | Type of Freight | TEUs 2021 | TEUs 2020 | % Change | Freight Tonnage (metric tons) |
|---|---|---|---|---|---|---|---|
| 1 | Port of Los Angeles * | Los Angeles | container, break bulk, dry bulk, liquid bulk, automotive, heavy lift, special project cargo, refrigerated, passenger | 10,677,610 | 9,213,396 | 15.9% | 222,000,000 |
| 2 | Port of Long Beach | Long Beach, Calif. | container, break bulk, dry bulk, liquid bulk, automotive, heavy lift, special project cargo, refrigerated, passenger | 9,384,368 | 8,113,315 | 15.7% | 196,386,014 |
| 3 | Port of New York and New Jersey ^ | New York | container, break bulk, dry bulk, liquid bulk, automotive, heavy lift, special project cargo, refrigerated, passenger | 8,985,929 | 7,585,819 | 18.5% | 112,216,428 |
| 4 | Port of Savannah ^ | Savannah, Ga. | container, break bulk, heavy lift, automobile, refrigerated | 5,613,163 | 4,682,249 | 19.9% | 39,419,938 |
| 5 | Ports of Colon, Cristobal and Manzanillo ** | Colón, Panama | container, liquid bulk, dry bulk, passenger, transshipping | 4,915,975 | 4,454,902 | 10.3% | |
| 6 | Northwest Seaport Alliance | Seattle and Tacoma, Wash. | container, break bulk, liquid bulk, dry bulk, automobile, heavy lift, special project cargo, refrigerated, passenger, air cargo | 3,736,206 | 3,320,379 | 12.5% | 27,363,475 |
| 7 | Port of Vancouver | Vancouver, British Columbia | container, break bulk, dry bulk, liquid bulk, automobile, special project cargo, passenger | 3,678,952 | 3,467,521 | 6.1% | |
| 8 | Port of Balboa/PSA Panama International Terminal | Panama Int'l Terminals, Panama | container, transshipping | 3,561,432 | 3,161,658 | 12.6% | |
| 9 | Port of Virginia | Norfolk, Va. | container, break bulk, dry bulk, liquid bulk, automobile | 3,522,834 | 2,813,415 | 25.2% | 55,797,100 |
| 10 | Port Houston | Houston | container, break bulk, dry bulk, liquid bulk | 3,453,226 | 3,001,164 | 15.1% | 40,399,937 |
| 11 | Port of Manzanillo | Manzanillo, Colima, Mexico | container, dry bulk, liquid bulk | 3,371,438 | 2,909,632 | 15.9% | 35,024,782 |
| 12 | Port of Charleston ^ | Charleston, S.C. | container, break bulk, dry bulk, automobile, refrigerated | 2,751,442 | 2,309,995 | 19.1% | 22,631,975 |
| 13 | Port of Oakland ^ | Oakland, Calif. | container | 2,448,243 | 2,461,262 | -0.5% | 17,635,455 |
| 14 | Port of Kingston | Kingston, Jamaica | container, heavy lift, liquid bulk | 1,975,401 | 1,611,637 | 22.6% | |
| 15 | Port of Montreal | Montreal | container, break bulk, dry bulk, liquid bulk, passenger | 1,728,114 | 1,600,000 | 8.0% | 34,023,135 |
| 16 | Port of Lázaro Cárdenas | Lázaro Cárdenas, Michoacán, Mexico | container, break bulk, dry bulk, liquid bulk | 1,686,076 | 1,063,675 | 58.5% | |
| 17 | Port of Freeport | Freeport, Bahamas | container, passenger | 1,642,780 | 1,231,703 | 33.4% | |
| 18 | Port of San Juan ^ | San Juan, Puerto Rico | container | 1,438,738 | 1,490,218 | -3.5% | 8,470,533 |
| 19 | Port of Jacksonville *** | Jacksonville, Fla. | container, break bulk, dry bulk, liquid bulk, automobile, heavy lift, refrigerated | 1,407,310 | 1,277,161 | 10.2% | 9,378,906 |
| 20 | Moín Container Terminal | Límon, Costa Rica | container | 1,319,372 | 1,213,431 | 8.7% | |
| 21 | Port Miami *** | Miami | container, passenger | 1,254,062 | 1,066,738 | 17.6% | 10,114,409 |
| 22 | Port of Veracruz | Veracruz, Veracruz, Mexico | container, dry bulk, liquid bulk, automobile | 1,165,043 | 1,005,936 | 15.8% | |
| 23 | Port of Prince Rupert | Prince Rupert, British Columbia | container, break bulk, dry bulk, liquid bulk, special project cargo, passenger | 1,054,836 | 1,141,390 | -7.6% | 25,071,050 |
| 24 | Port Everglades *** | Broward County, Fla. | container, break bulk, dry bulk, liquid bulk, passenger | 1,038,179 | 945,512 | 9.8% | 21,346,991 |
| 25 | Port of Baltimore ^ | Baltimore | container, break bulk, dry bulk, liquid bulk, automobile, refrigerated, passenger | 1,022,683 | 1,051,840 | -2.8% | 31,934,742 |
| NOTE: Data for the ports of Manzanillo (Mexico), Kingston, Lázaro Cárdenas, Freeport, San Juan, Moín Container Terminal and Veracruz are from the United Nations Economic Commission for Latin America and the Carribbean. Data for the ports of Balboa, PSA Panama International Terminal, Cristobal, Colon Container Terminal and Manzanillo International Terminal are from the Georgia Tech Panama Logistics Innovation and Research Center. All other data is from respective port authorities. * Tonnage data for the Port of Los Angeles is from its fiscal year ending June 30, 2021. ** Includes data regarding the Panamanian ports of Cristobal, Colon Container Terminal and Manzanillo International Terminal; not to be confused with the Port of Manzanillo in Colima, Mexico. *** TEU and tonnage data for the Port of Jacksonville, Port Miami and Port Everglades is from their fiscal year ending Sept. 30, 2021. ^ Tonnage data for the ports of New York and New Jersey, Savannah, Charleston, Oakland, San Juan and Baltimore are from calendar year 2020, sourced from the United States Army Corp of Engineers. All other tonnage data is from calendar year 2021. |
|||||||


Last year saw air- and sea-freight volumes bounce back from supply chain struggles.

If your company appears in the 2022 list, you have a few ways to announce it. Visit our logo library to get web- and print-ready graphics.

Learn more about Transport Topics’ Top 50 Global Freight Companies publication.
Hapag-Lloyd Profitable Despite Global Downturn
HAMBURG, Germany — The German shipping company Hapag-Lloyd says it has made a good profit so far this year, despite the economic downturn and several international crises.
November 14, 2024Amazon Aims at Temu With Low-Priced Storefront Called Haul

Amazon launched an online storefront designed to compete with Temu, the low-cost shopping app that gained traction with shoppers who trade longer shipping times for rock-bottom prices.
November 13, 2024Nikola Leads Field in Hydrogen Fuel Cell EV Deployment

Hydrogen fuel cell electric vehicles may be envisioned as the future workhorse of a decarbonized longhaul freight sector, but their development has proceeded at a measured pace.
November 7, 2024Retailers Offer ‘Returnless Refunds’ to Reduce Shipping Fees

Returnless refunds are a tool that more retailers are using to keep online shoppers happy and to reduce shipping fees, processing time and other ballooning costs from returned products.
November 4, 2024Ocean, Airfreight Volumes Falter in Rocky 2023
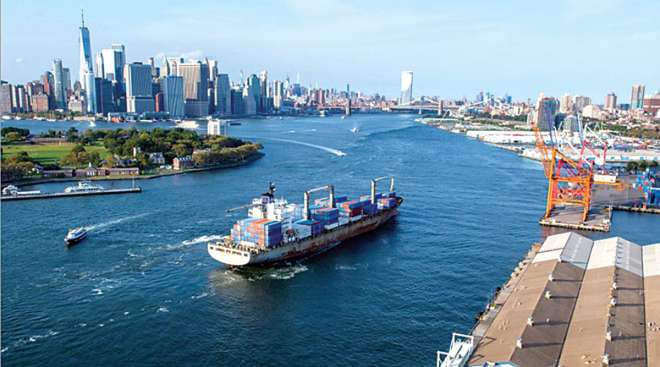
Shippers faced hurdles with both ocean freight and airfreight in 2023, leading to declined volumes at North America's top container ports and airports.
November 1, 2024Top 50 Freight Companies Endure Global Trade Slump
A slump in international trade, geopolitical conflicts and economic uncertainty created a difficult business environment for the largest transportation and logistics providers in 2023.
November 1, 2024Looking Up: Airfreight Demand Takes Off in 2024
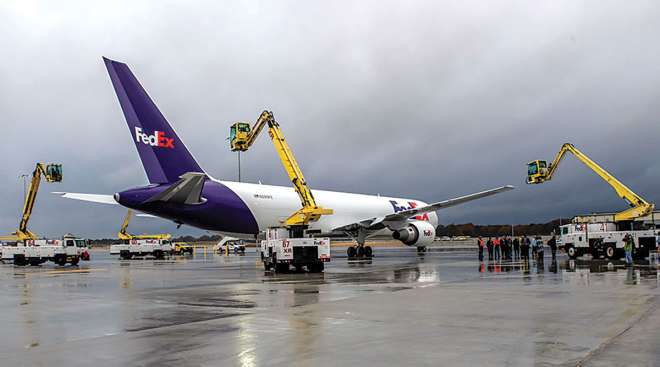
Demand for global air cargo traffic continues to increase amid e-commerce growth and ocean shipping constraints, driving prices higher as carriers and airports seek new efficiencies to maximize capacity.
November 1, 2024Amazon Exceeds Profit Forecasts, Predicts Q4 Sales Surge

“As we get into the holiday season, we’re excited about what we have in store for customers,” CEO Andy Jassy said in a statement.
October 31, 2024DSV Secures $5.4 Billion in Bonds for DB Schenker Deal
The Danish transport company sold a six-part bond deal with maturities ranging from two to 10 years, according to a person familiar with the matter.
October 30, 2024Anchorage’s International Airport Adds 5 Carriers

The Ted Stevens Anchorage International Airport has added five new international cargo carriers to its lineup this year, setting the stage for continued growth.
October 25, 2024-

2023
-
2022
-
2021
-
2020
-
2019
-
2018
-
2017
-
2016
-
2015