Supply chain disruptions may be easing, but freight volumes continue to stir anxiety in shippers.

Non-asset based companies join the field in this year’s Global Freight Top 50 list.

Get a continent-by-continent and country-by-country look at where the Top 50 Global Freight Companies are based.
Rankings
Port Data
| Rank | Port Name | City | Type of Freight | TEUs 2021 | TEUs 2020 | % Change | Freight Tonnage (metric tons) |
|---|---|---|---|---|---|---|---|
| 1 | Port of Los Angeles * | Los Angeles | container, break bulk, dry bulk, liquid bulk, automotive, heavy lift, special project cargo, refrigerated, passenger | 10,677,610 | 9,213,396 | 15.9% | 222,000,000 |
| 2 | Port of Long Beach | Long Beach, Calif. | container, break bulk, dry bulk, liquid bulk, automotive, heavy lift, special project cargo, refrigerated, passenger | 9,384,368 | 8,113,315 | 15.7% | 196,386,014 |
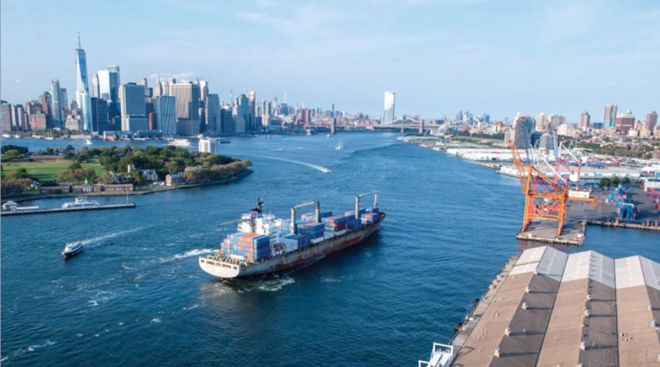
| 3 | Port of New York and New Jersey ^ | New York | container, break bulk, dry bulk, liquid bulk, automotive, heavy lift, special project cargo, refrigerated, passenger | 8,985,929 | 7,585,819 | 18.5% | 112,216,428 |
| 4 | Port of Savannah ^ | Savannah, Ga. | container, break bulk, heavy lift, automobile, refrigerated | 5,613,163 | 4,682,249 | 19.9% | 39,419,938 |
| 5 | Ports of Colon, Cristobal and Manzanillo ** | Colón, Panama | container, liquid bulk, dry bulk, passenger, transshipping | 4,915,975 | 4,454,902 | 10.3% | |
| 6 | Northwest Seaport Alliance | Seattle and Tacoma, Wash. | container, break bulk, liquid bulk, dry bulk, automobile, heavy lift, special project cargo, refrigerated, passenger, air cargo | 3,736,206 | 3,320,379 | 12.5% | 27,363,475 |
| 7 | Port of Vancouver | Vancouver, British Columbia | container, break bulk, dry bulk, liquid bulk, automobile, special project cargo, passenger | 3,678,952 | 3,467,521 | 6.1% | |
| 8 | Port of Balboa/PSA Panama International Terminal | Panama Int'l Terminals, Panama | container, transshipping | 3,561,432 | 3,161,658 | 12.6% | |
| 9 | Port of Virginia | Norfolk, Va. | container, break bulk, dry bulk, liquid bulk, automobile | 3,522,834 | 2,813,415 | 25.2% | 55,797,100 |
| 10 | Port Houston | Houston | container, break bulk, dry bulk, liquid bulk | 3,453,226 | 3,001,164 | 15.1% | 40,399,937 |
| 11 | Port of Manzanillo | Manzanillo, Colima, Mexico | container, dry bulk, liquid bulk | 3,371,438 | 2,909,632 | 15.9% | 35,024,782 |
| 12 | Port of Charleston ^ | Charleston, S.C. | container, break bulk, dry bulk, automobile, refrigerated | 2,751,442 | 2,309,995 | 19.1% | 22,631,975 |
| 13 | Port of Oakland ^ | Oakland, Calif. | container | 2,448,243 | 2,461,262 | -0.5% | 17,635,455 |
| 14 | Port of Kingston | Kingston, Jamaica | container, heavy lift, liquid bulk | 1,975,401 | 1,611,637 | 22.6% | |
| 15 | Port of Montreal | Montreal | container, break bulk, dry bulk, liquid bulk, passenger | 1,728,114 | 1,600,000 | 8.0% | 34,023,135 |
| 16 | Port of Lázaro Cárdenas | Lázaro Cárdenas, Michoacán, Mexico | container, break bulk, dry bulk, liquid bulk | 1,686,076 | 1,063,675 | 58.5% | |
| 17 | Port of Freeport | Freeport, Bahamas | container, passenger | 1,642,780 | 1,231,703 | 33.4% | |
| 18 | Port of San Juan ^ | San Juan, Puerto Rico | container | 1,438,738 | 1,490,218 | -3.5% | 8,470,533 |
| 19 | Port of Jacksonville *** | Jacksonville, Fla. | container, break bulk, dry bulk, liquid bulk, automobile, heavy lift, refrigerated | 1,407,310 | 1,277,161 | 10.2% | 9,378,906 |
| 20 | Moín Container Terminal | Límon, Costa Rica | container | 1,319,372 | 1,213,431 | 8.7% | |
| 21 | Port Miami *** | Miami | container, passenger | 1,254,062 | 1,066,738 | 17.6% | 10,114,409 |
| 22 | Port of Veracruz | Veracruz, Veracruz, Mexico | container, dry bulk, liquid bulk, automobile | 1,165,043 | 1,005,936 | 15.8% | |
| 23 | Port of Prince Rupert | Prince Rupert, British Columbia | container, break bulk, dry bulk, liquid bulk, special project cargo, passenger | 1,054,836 | 1,141,390 | -7.6% | 25,071,050 |
| 24 | Port Everglades *** | Broward County, Fla. | container, break bulk, dry bulk, liquid bulk, passenger | 1,038,179 | 945,512 | 9.8% | 21,346,991 |
| 25 | Port of Baltimore ^ | Baltimore | container, break bulk, dry bulk, liquid bulk, automobile, refrigerated, passenger | 1,022,683 | 1,051,840 | -2.8% | 31,934,742 |
| NOTE: Data for the ports of Manzanillo (Mexico), Kingston, Lázaro Cárdenas, Freeport, San Juan, Moín Container Terminal and Veracruz are from the United Nations Economic Commission for Latin America and the Carribbean. Data for the ports of Balboa, PSA Panama International Terminal, Cristobal, Colon Container Terminal and Manzanillo International Terminal are from the Georgia Tech Panama Logistics Innovation and Research Center. All other data is from respective port authorities. * Tonnage data for the Port of Los Angeles is from its fiscal year ending June 30, 2021. ** Includes data regarding the Panamanian ports of Cristobal, Colon Container Terminal and Manzanillo International Terminal; not to be confused with the Port of Manzanillo in Colima, Mexico. *** TEU and tonnage data for the Port of Jacksonville, Port Miami and Port Everglades is from their fiscal year ending Sept. 30, 2021. ^ Tonnage data for the ports of New York and New Jersey, Savannah, Charleston, Oakland, San Juan and Baltimore are from calendar year 2020, sourced from the United States Army Corp of Engineers. All other tonnage data is from calendar year 2021. |
|||||||


Last year saw air- and sea-freight volumes bounce back from supply chain struggles.

If your company appears in the 2022 list, you have a few ways to announce it. Visit our logo library to get web- and print-ready graphics.

Learn more about Transport Topics’ Top 50 Global Freight Companies publication.
Big Emissions Bills Are Coming for Ships Sailing in Europe
The maritime industry will join the European Union's Emissions Trading System in January, meaning big ships will start paying for carbon emissions.
September 18, 2023DHL Express Opens Miami-to-Argentina Cargo Shipping Route

DHL Express started shipping this week from Miami to Argentina, as part of its cargo hauling expansion from South Florida to Latin America.
September 8, 2023AI Fused With Trade Data Could Smooth Clunky Supply Chains

The dawn of artificial intelligence tools like ChatGPT may revolutionize the way data can be used to ferret out risks and opportunities in the $32 trillion global trading system.
September 5, 2023Port of Baltimore Welcomes Biggest Containership Ever

On Aug. 19, the largest containership to ever visit Maryland sailed into the Port of Baltimore.
August 21, 2023East and West Coast Ports Spar Over Who's No. 1
It came as a surprise at the ports of Los Angeles and Long Beach when the ports of New York-New Jersey said their complex was the busiest cargo container handler in America.
August 15, 2023Global Ocean Shipping Costs Creep Higher
Spot rates for shipping containers jumped by the most in more than two years, a sign that a 16-month slump in ocean freight costs that helped ease the sting of goods inflation is over.
August 3, 2023DHL Plans Expansion in Latin America

Five Latin American nations could share $556 million by 2028 as contract logistics provider DHL Supply Chain plans to expand its regional fulfillment network.
July 14, 2023IMO Countries Agree to Net-Zero Shipping Emissions by 2050
Maritime nations agreed July 7 to slash emissions from the shipping industry to net zero by about 2050 in a deal that several experts and nations say falls short of what’s needed.
July 7, 2023CSX and CPKC Will Connect to Increase Traffic in Southeast
CSX and CPKC railroads announced a deal June 28 that will allow them to beef up a little-used connection between their two networks in the southeastern United States to handle more freight.
June 29, 2023Pepsi Leads Calls for EU to Roll Out Green Trucks Faster

Companies including PepsiCo Inc. and Nike Inc. are calling for the European Union to implement stricter emissions targets for trucks, which the firms say will lower costs in the long run.
June 26, 2023-

2023
-
2022
-
2021
-
2020
-
2019
-
2018
-
2017
-
2016
-
2015