Supply chain disruptions may be easing, but freight volumes continue to stir anxiety in shippers.

Non-asset based companies join the field in this year’s Global Freight Top 50 list.

Get a continent-by-continent and country-by-country look at where the Top 50 Global Freight Companies are based.
Rankings
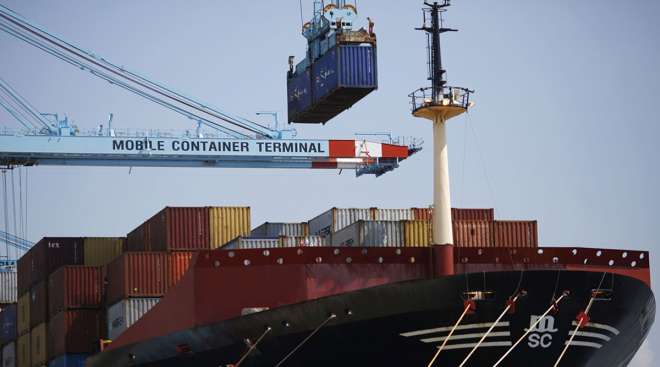
Port Data
| Rank | Port Name | City | Type of Freight | TEUs 2021 | TEUs 2020 | % Change | Freight Tonnage (metric tons) |
|---|---|---|---|---|---|---|---|
| 1 | Port of Los Angeles * | Los Angeles | container, break bulk, dry bulk, liquid bulk, automotive, heavy lift, special project cargo, refrigerated, passenger | 10,677,610 | 9,213,396 | 15.9% | 222,000,000 |
| 2 | Port of Long Beach | Long Beach, Calif. | container, break bulk, dry bulk, liquid bulk, automotive, heavy lift, special project cargo, refrigerated, passenger | 9,384,368 | 8,113,315 | 15.7% | 196,386,014 |
| 3 | Port of New York and New Jersey ^ | New York | container, break bulk, dry bulk, liquid bulk, automotive, heavy lift, special project cargo, refrigerated, passenger | 8,985,929 | 7,585,819 | 18.5% | 112,216,428 |
| 4 | Port of Savannah ^ | Savannah, Ga. | container, break bulk, heavy lift, automobile, refrigerated | 5,613,163 | 4,682,249 | 19.9% | 39,419,938 |
| 5 | Ports of Colon, Cristobal and Manzanillo ** | Colón, Panama | container, liquid bulk, dry bulk, passenger, transshipping | 4,915,975 | 4,454,902 | 10.3% | |
| 6 | Northwest Seaport Alliance | Seattle and Tacoma, Wash. | container, break bulk, liquid bulk, dry bulk, automobile, heavy lift, special project cargo, refrigerated, passenger, air cargo | 3,736,206 | 3,320,379 | 12.5% | 27,363,475 |
| 7 | Port of Vancouver | Vancouver, British Columbia | container, break bulk, dry bulk, liquid bulk, automobile, special project cargo, passenger | 3,678,952 | 3,467,521 | 6.1% | |
| 8 | Port of Balboa/PSA Panama International Terminal | Panama Int'l Terminals, Panama | container, transshipping | 3,561,432 | 3,161,658 | 12.6% | |
| 9 | Port of Virginia | Norfolk, Va. | container, break bulk, dry bulk, liquid bulk, automobile | 3,522,834 | 2,813,415 | 25.2% | 55,797,100 |
| 10 | Port Houston | Houston | container, break bulk, dry bulk, liquid bulk | 3,453,226 | 3,001,164 | 15.1% | 40,399,937 |
| 11 | Port of Manzanillo | Manzanillo, Colima, Mexico | container, dry bulk, liquid bulk | 3,371,438 | 2,909,632 | 15.9% | 35,024,782 |
| 12 | Port of Charleston ^ | Charleston, S.C. | container, break bulk, dry bulk, automobile, refrigerated | 2,751,442 | 2,309,995 | 19.1% | 22,631,975 |
| 13 | Port of Oakland ^ | Oakland, Calif. | container | 2,448,243 | 2,461,262 | -0.5% | 17,635,455 |
| 14 | Port of Kingston | Kingston, Jamaica | container, heavy lift, liquid bulk | 1,975,401 | 1,611,637 | 22.6% | |
| 15 | Port of Montreal | Montreal | container, break bulk, dry bulk, liquid bulk, passenger | 1,728,114 | 1,600,000 | 8.0% | 34,023,135 |
| 16 | Port of Lázaro Cárdenas | Lázaro Cárdenas, Michoacán, Mexico | container, break bulk, dry bulk, liquid bulk | 1,686,076 | 1,063,675 | 58.5% | |
| 17 | Port of Freeport | Freeport, Bahamas | container, passenger | 1,642,780 | 1,231,703 | 33.4% | |
| 18 | Port of San Juan ^ | San Juan, Puerto Rico | container | 1,438,738 | 1,490,218 | -3.5% | 8,470,533 |
| 19 | Port of Jacksonville *** | Jacksonville, Fla. | container, break bulk, dry bulk, liquid bulk, automobile, heavy lift, refrigerated | 1,407,310 | 1,277,161 | 10.2% | 9,378,906 |
| 20 | Moín Container Terminal | Límon, Costa Rica | container | 1,319,372 | 1,213,431 | 8.7% | |
| 21 | Port Miami *** | Miami | container, passenger | 1,254,062 | 1,066,738 | 17.6% | 10,114,409 |
| 22 | Port of Veracruz | Veracruz, Veracruz, Mexico | container, dry bulk, liquid bulk, automobile | 1,165,043 | 1,005,936 | 15.8% | |
| 23 | Port of Prince Rupert | Prince Rupert, British Columbia | container, break bulk, dry bulk, liquid bulk, special project cargo, passenger | 1,054,836 | 1,141,390 | -7.6% | 25,071,050 |
| 24 | Port Everglades *** | Broward County, Fla. | container, break bulk, dry bulk, liquid bulk, passenger | 1,038,179 | 945,512 | 9.8% | 21,346,991 |
| 25 | Port of Baltimore ^ | Baltimore | container, break bulk, dry bulk, liquid bulk, automobile, refrigerated, passenger | 1,022,683 | 1,051,840 | -2.8% | 31,934,742 |
| NOTE: Data for the ports of Manzanillo (Mexico), Kingston, Lázaro Cárdenas, Freeport, San Juan, Moín Container Terminal and Veracruz are from the United Nations Economic Commission for Latin America and the Carribbean. Data for the ports of Balboa, PSA Panama International Terminal, Cristobal, Colon Container Terminal and Manzanillo International Terminal are from the Georgia Tech Panama Logistics Innovation and Research Center. All other data is from respective port authorities. * Tonnage data for the Port of Los Angeles is from its fiscal year ending June 30, 2021. ** Includes data regarding the Panamanian ports of Cristobal, Colon Container Terminal and Manzanillo International Terminal; not to be confused with the Port of Manzanillo in Colima, Mexico. *** TEU and tonnage data for the Port of Jacksonville, Port Miami and Port Everglades is from their fiscal year ending Sept. 30, 2021. ^ Tonnage data for the ports of New York and New Jersey, Savannah, Charleston, Oakland, San Juan and Baltimore are from calendar year 2020, sourced from the United States Army Corp of Engineers. All other tonnage data is from calendar year 2021. |
|||||||


Last year saw air- and sea-freight volumes bounce back from supply chain struggles.

If your company appears in the 2022 list, you have a few ways to announce it. Visit our logo library to get web- and print-ready graphics.

Learn more about Transport Topics’ Top 50 Global Freight Companies publication.
UPS to Sell Coyote Logistics to RXO

UPS Inc. has entered into a definitive agreement to sell its asset-light freight brokerage business, Coyote Logistics, to RXO Inc., the company announced June 23.
June 24, 2024Amazon Is Shifting to Recycled Paper Filling for Packages
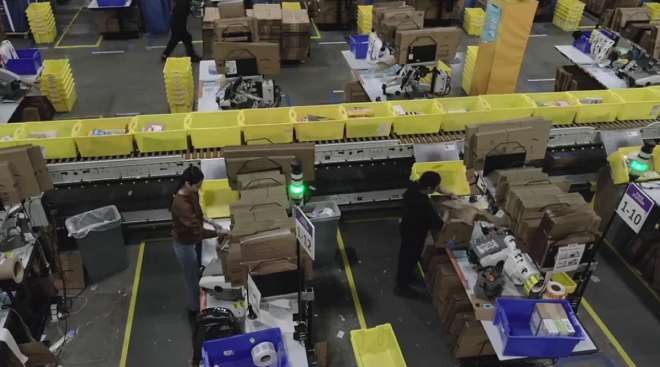
Amazon is shifting from the plastic air pillows used for packaging in North America to recycled paper because it’s more environmentally sound, and it says paper just works better.
June 20, 2024Thousands of Drivers File Arbitration Claims Against Amazon

NEW YORK — Thousands of delivery drivers filed legal claims against Amazon on June 11, alleging the company’s classification of them as independent contractors has led to unpaid wages.
June 11, 2024Dockworkers at Ports From Boston to Houston Halt Labor Talks
The union representing dockworkers at East and Gulf Coast container ports has suspended labor contract negotiations set for June 11, citing a dispute over automation.
June 11, 2024Maersk Raises Profit Outlook
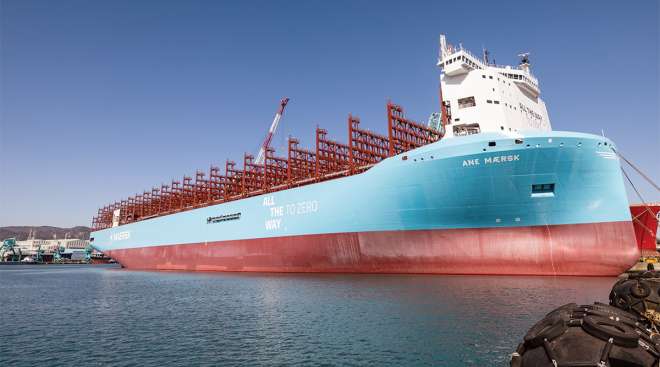
A.P. Moller-Maersk, a bellwether for global trade, said the world’s supply lines are more impacted than previously expected by the ripple effects coming from the congestion in the Red Sea.
June 4, 2024Einride Becomes Peterbilt’s Biggest BET Customer
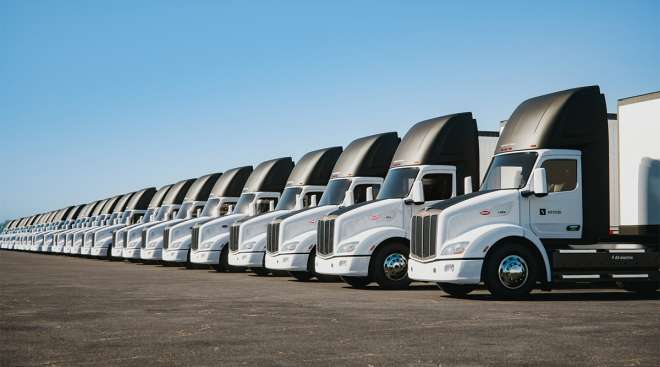
Einride will buy 150 Model 579EV battery-electric trucks from Peterbilt, the truck maker’s biggest EV order so far, the companies said.
June 3, 2024Ships Diverted From Red Sea Send Ripple Effects Across Globe
Nearly six months into the Houthis’ relentless campaign to protest Israel’s war in Gaza, the economic fallout is widening.
June 3, 2024Amazon to Expand US Drone Service

Amazon.com’s Prime Air drone program has been cleared by regulators to fly devices beyond the visual line of sight of pilots, increasing range and giving more customers access to the service.
May 30, 2024Some Shipping Container Costs Hit $10,000
Companies transporting goods from Asia face costs of as much $10,000 for an urgent full-size shipping container over the next month — about double current spot rates.
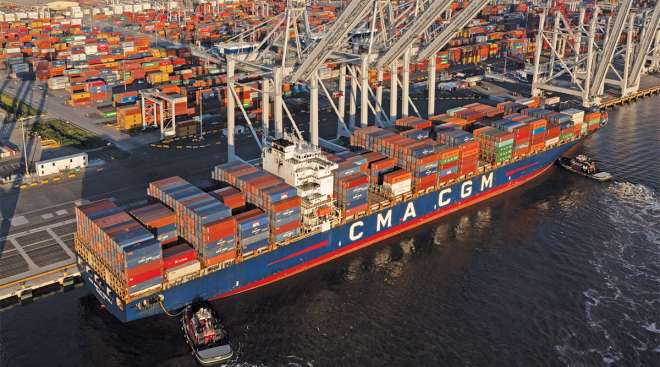
May 29, 2024Trade Strains Boost Ocean Shipping Cargo Rates
Global goods trade is showing signs of accelerating after last year’s slump, pushing up shipping rates and giving some supply chain managers flashbacks to the demand spike three years ago.
May 28, 2024-

2023
-
2022
-
2021
-
2020
-
2019
-
2018
-
2017
-
2016
-
2015